Real-World Test Results
Here are some common findings from A/B tests on safelink pages:
- Green buttons: Often outperform blue by 5-10%
- 8-second timers: Sweet spot for most sites
- Dark backgrounds: Higher ad visibility than light
- File details: Showing file name/size increases trust
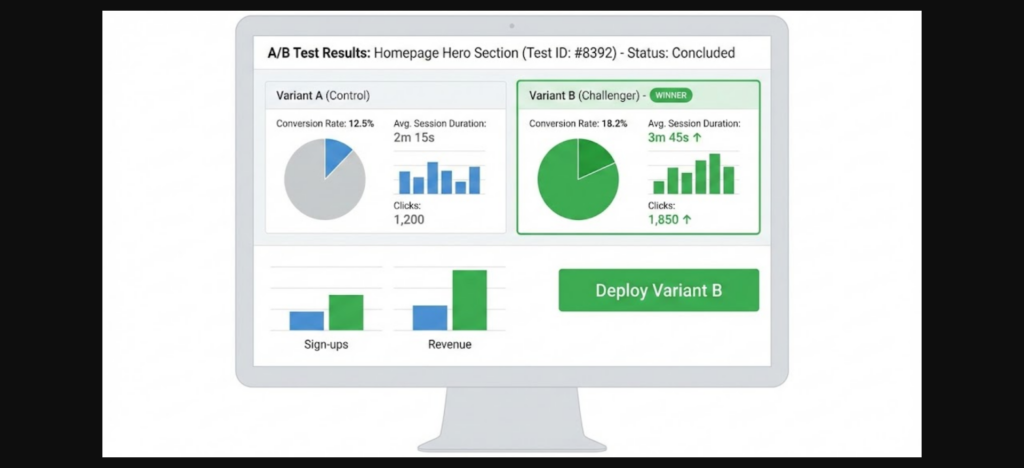
Implementing Winners
Once you have a winner:
- Deploy the winning variant to 100% of traffic
- Document what you learned
- Plan your next test
- Monitor for any regression
Conclusion
A/B testing transforms guesswork into data-driven decisions. By systematically testing elements of your safelink pages, you can incrementally improve revenue without risking your entire traffic. Start with one test today – even a 5% improvement adds up over millions of visitors.
Ready to optimize your safelink pages? Get WP Safelink with built-in A/B testing capabilities.
Analyzing Results
Key Metrics to Compare
- Revenue per visitor: Total earnings divided by visitors
- Click-through rate: Percentage who click download
- Ad viewability: Percentage of ads actually seen
- Bounce rate: Percentage who leave before download
- Time on page: How long users stay
Statistical Significance
Don’t declare a winner too early. Wait until:
- Each variant has 1,000+ visitors
- Test has run for at least 7 days
- Confidence level reaches 95%+
Common A/B Testing Mistakes
1. Testing Too Many Things at Once
Change only ONE element per test. If you change button color AND timer length, you won’t know which caused the difference.
2. Ending Tests Too Early
Early results can be misleading. A variant might look like a winner on day 1 but lose by day 7. Wait for statistical significance.
3. Ignoring Mobile
Desktop and mobile users behave differently. Segment your results or run separate tests for each device type.
Real-World Test Results
Here are some common findings from A/B tests on safelink pages:
- Green buttons: Often outperform blue by 5-10%
- 8-second timers: Sweet spot for most sites
- Dark backgrounds: Higher ad visibility than light
- File details: Showing file name/size increases trust
Implementing Winners
Once you have a winner:
- Deploy the winning variant to 100% of traffic
- Document what you learned
- Plan your next test
- Monitor for any regression
Conclusion
A/B testing transforms guesswork into data-driven decisions. By systematically testing elements of your safelink pages, you can incrementally improve revenue without risking your entire traffic. Start with one test today – even a 5% improvement adds up over millions of visitors.
Ready to optimize your safelink pages? Get WP Safelink with built-in A/B testing capabilities.
What to Test
1. Countdown Timer Length
Test these common timer lengths:
- Short (3-5 seconds): Higher completion rate, lower ad revenue
- Medium (6-10 seconds): Balanced approach
- Long (15-30 seconds): Higher ad revenue, higher bounce rate
2. Download Button
Test variations of:
- Color: Green, blue, orange, red
- Size: Small, medium, large
- Text: “Download”, “Get File”, “Download Now”, “Click Here”
- Position: Top, center, bottom of page
3. Ad Placement
Test different ad configurations:
- Number of ads: 1 vs 2 vs 3 ad units
- Position: Above content vs below vs sidebar
- Size: Standard sizes vs responsive
- Type: Display vs native vs video
4. Page Design
- Background: Dark vs light theme
- Layout: Centered vs full-width
- Content: Minimal vs detailed file info
- Branding: Logo prominent vs subtle
Analyzing Results
Key Metrics to Compare
- Revenue per visitor: Total earnings divided by visitors
- Click-through rate: Percentage who click download
- Ad viewability: Percentage of ads actually seen
- Bounce rate: Percentage who leave before download
- Time on page: How long users stay
Statistical Significance
Don’t declare a winner too early. Wait until:
- Each variant has 1,000+ visitors
- Test has run for at least 7 days
- Confidence level reaches 95%+
Common A/B Testing Mistakes
1. Testing Too Many Things at Once
Change only ONE element per test. If you change button color AND timer length, you won’t know which caused the difference.
2. Ending Tests Too Early
Early results can be misleading. A variant might look like a winner on day 1 but lose by day 7. Wait for statistical significance.
3. Ignoring Mobile
Desktop and mobile users behave differently. Segment your results or run separate tests for each device type.
Real-World Test Results
Here are some common findings from A/B tests on safelink pages:
- Green buttons: Often outperform blue by 5-10%
- 8-second timers: Sweet spot for most sites
- Dark backgrounds: Higher ad visibility than light
- File details: Showing file name/size increases trust
Implementing Winners
Once you have a winner:
- Deploy the winning variant to 100% of traffic
- Document what you learned
- Plan your next test
- Monitor for any regression
Conclusion
A/B testing transforms guesswork into data-driven decisions. By systematically testing elements of your safelink pages, you can incrementally improve revenue without risking your entire traffic. Start with one test today – even a 5% improvement adds up over millions of visitors.
Ready to optimize your safelink pages? Get WP Safelink with built-in A/B testing capabilities.
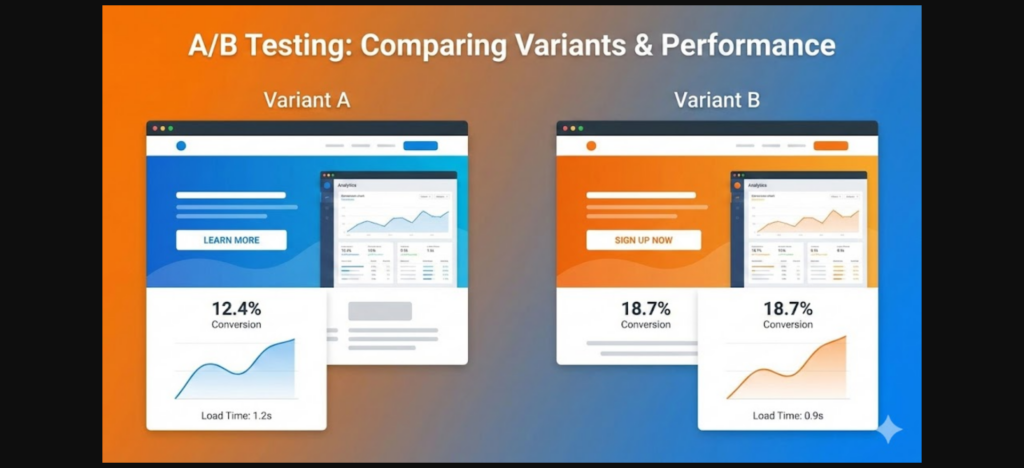
What is A/B Testing?
A/B testing (split testing) compares two versions of a page to see which performs better. You show Version A to half your visitors and Version B to the other half, then measure which generates more revenue.
Why A/B Test Safelink Pages?
Small changes can have big impacts on revenue:
- Timer length: 5 seconds vs 10 seconds – which earns more?
- Button color: Green vs blue – which gets more clicks?
- Ad placement: Above countdown vs below – which has higher viewability?
- Page layout: Minimal vs detailed – which converts better?
Setting Up A/B Tests in WP Safelink
Step 1: Create Two Page Variants
In WP Safelink, create two versions of your redirect page with one key difference:
- Go to WP Safelink ??? Templates
- Duplicate your current template
- Modify ONE element (e.g., timer length)
- Save as “Template B”
Step 2: Configure Traffic Split
Set up how traffic is distributed between variants:
- 50/50 split: Standard for most tests
- 90/10 split: For risky changes you want to test safely
- Traffic minimum: Need at least 1,000 visitors per variant for statistical significance
Step 3: Track Results
Monitor these key metrics:
What to Test
1. Countdown Timer Length
Test these common timer lengths:
- Short (3-5 seconds): Higher completion rate, lower ad revenue
- Medium (6-10 seconds): Balanced approach
- Long (15-30 seconds): Higher ad revenue, higher bounce rate
2. Download Button
Test variations of:
- Color: Green, blue, orange, red
- Size: Small, medium, large
- Text: “Download”, “Get File”, “Download Now”, “Click Here”
- Position: Top, center, bottom of page
3. Ad Placement
Test different ad configurations:
- Number of ads: 1 vs 2 vs 3 ad units
- Position: Above content vs below vs sidebar
- Size: Standard sizes vs responsive
- Type: Display vs native vs video
4. Page Design
- Background: Dark vs light theme
- Layout: Centered vs full-width
- Content: Minimal vs detailed file info
- Branding: Logo prominent vs subtle
Analyzing Results
Key Metrics to Compare
- Revenue per visitor: Total earnings divided by visitors
- Click-through rate: Percentage who click download
- Ad viewability: Percentage of ads actually seen
- Bounce rate: Percentage who leave before download
- Time on page: How long users stay
Statistical Significance
Don’t declare a winner too early. Wait until:
- Each variant has 1,000+ visitors
- Test has run for at least 7 days
- Confidence level reaches 95%+
Common A/B Testing Mistakes
1. Testing Too Many Things at Once
Change only ONE element per test. If you change button color AND timer length, you won’t know which caused the difference.
2. Ending Tests Too Early
Early results can be misleading. A variant might look like a winner on day 1 but lose by day 7. Wait for statistical significance.
3. Ignoring Mobile
Desktop and mobile users behave differently. Segment your results or run separate tests for each device type.
Real-World Test Results
Here are some common findings from A/B tests on safelink pages:
- Green buttons: Often outperform blue by 5-10%
- 8-second timers: Sweet spot for most sites
- Dark backgrounds: Higher ad visibility than light
- File details: Showing file name/size increases trust
Implementing Winners
Once you have a winner:
- Deploy the winning variant to 100% of traffic
- Document what you learned
- Plan your next test
- Monitor for any regression
Conclusion
A/B testing transforms guesswork into data-driven decisions. By systematically testing elements of your safelink pages, you can incrementally improve revenue without risking your entire traffic. Start with one test today – even a 5% improvement adds up over millions of visitors.
Ready to optimize your safelink pages? Get WP Safelink with built-in A/B testing capabilities.
Think your safelink pages are optimized? Without A/B testing, you’re just guessing. This guide shows you how to systematically test and improve your WP Safelink pages for maximum revenue.
What is A/B Testing?
A/B testing (split testing) compares two versions of a page to see which performs better. You show Version A to half your visitors and Version B to the other half, then measure which generates more revenue.
Why A/B Test Safelink Pages?
Small changes can have big impacts on revenue:
- Timer length: 5 seconds vs 10 seconds – which earns more?
- Button color: Green vs blue – which gets more clicks?
- Ad placement: Above countdown vs below – which has higher viewability?
- Page layout: Minimal vs detailed – which converts better?
Setting Up A/B Tests in WP Safelink
Step 1: Create Two Page Variants
In WP Safelink, create two versions of your redirect page with one key difference:
- Go to WP Safelink ??? Templates
- Duplicate your current template
- Modify ONE element (e.g., timer length)
- Save as “Template B”
Step 2: Configure Traffic Split
Set up how traffic is distributed between variants:
- 50/50 split: Standard for most tests
- 90/10 split: For risky changes you want to test safely
- Traffic minimum: Need at least 1,000 visitors per variant for statistical significance
Step 3: Track Results
Monitor these key metrics:
What to Test
1. Countdown Timer Length
Test these common timer lengths:
- Short (3-5 seconds): Higher completion rate, lower ad revenue
- Medium (6-10 seconds): Balanced approach
- Long (15-30 seconds): Higher ad revenue, higher bounce rate
2. Download Button
Test variations of:
- Color: Green, blue, orange, red
- Size: Small, medium, large
- Text: “Download”, “Get File”, “Download Now”, “Click Here”
- Position: Top, center, bottom of page
3. Ad Placement
Test different ad configurations:
- Number of ads: 1 vs 2 vs 3 ad units
- Position: Above content vs below vs sidebar
- Size: Standard sizes vs responsive
- Type: Display vs native vs video
4. Page Design
- Background: Dark vs light theme
- Layout: Centered vs full-width
- Content: Minimal vs detailed file info
- Branding: Logo prominent vs subtle
Analyzing Results
Key Metrics to Compare
- Revenue per visitor: Total earnings divided by visitors
- Click-through rate: Percentage who click download
- Ad viewability: Percentage of ads actually seen
- Bounce rate: Percentage who leave before download
- Time on page: How long users stay
Statistical Significance
Don’t declare a winner too early. Wait until:
- Each variant has 1,000+ visitors
- Test has run for at least 7 days
- Confidence level reaches 95%+
Common A/B Testing Mistakes
1. Testing Too Many Things at Once
Change only ONE element per test. If you change button color AND timer length, you won’t know which caused the difference.
2. Ending Tests Too Early
Early results can be misleading. A variant might look like a winner on day 1 but lose by day 7. Wait for statistical significance.
3. Ignoring Mobile
Desktop and mobile users behave differently. Segment your results or run separate tests for each device type.
Real-World Test Results
Here are some common findings from A/B tests on safelink pages:
- Green buttons: Often outperform blue by 5-10%
- 8-second timers: Sweet spot for most sites
- Dark backgrounds: Higher ad visibility than light
- File details: Showing file name/size increases trust
Implementing Winners
Once you have a winner:
- Deploy the winning variant to 100% of traffic
- Document what you learned
- Plan your next test
- Monitor for any regression
Conclusion
A/B testing transforms guesswork into data-driven decisions. By systematically testing elements of your safelink pages, you can incrementally improve revenue without risking your entire traffic. Start with one test today – even a 5% improvement adds up over millions of visitors.
Ready to optimize your safelink pages? Get WP Safelink with built-in A/B testing capabilities.
Think your safelink pages are optimized? Without A/B testing, you’re just guessing. This guide shows you how to systematically test and improve your WP Safelink pages for maximum revenue.
What is A/B Testing?
A/B testing (split testing) compares two versions of a page to see which performs better. You show Version A to half your visitors and Version B to the other half, then measure which generates more revenue.
Why A/B Test Safelink Pages?
Small changes can have big impacts on revenue:
- Timer length: 5 seconds vs 10 seconds – which earns more?
- Button color: Green vs blue – which gets more clicks?
- Ad placement: Above countdown vs below – which has higher viewability?
- Page layout: Minimal vs detailed – which converts better?
Setting Up A/B Tests in WP Safelink
Step 1: Create Two Page Variants
In WP Safelink, create two versions of your redirect page with one key difference:
- Go to WP Safelink ??? Templates
- Duplicate your current template
- Modify ONE element (e.g., timer length)
- Save as “Template B”
Step 2: Configure Traffic Split
Set up how traffic is distributed between variants:
- 50/50 split: Standard for most tests
- 90/10 split: For risky changes you want to test safely
- Traffic minimum: Need at least 1,000 visitors per variant for statistical significance
Step 3: Track Results
Monitor these key metrics:
What to Test
1. Countdown Timer Length
Test these common timer lengths:
- Short (3-5 seconds): Higher completion rate, lower ad revenue
- Medium (6-10 seconds): Balanced approach
- Long (15-30 seconds): Higher ad revenue, higher bounce rate
2. Download Button
Test variations of:
- Color: Green, blue, orange, red
- Size: Small, medium, large
- Text: “Download”, “Get File”, “Download Now”, “Click Here”
- Position: Top, center, bottom of page
3. Ad Placement
Test different ad configurations:
- Number of ads: 1 vs 2 vs 3 ad units
- Position: Above content vs below vs sidebar
- Size: Standard sizes vs responsive
- Type: Display vs native vs video
4. Page Design
- Background: Dark vs light theme
- Layout: Centered vs full-width
- Content: Minimal vs detailed file info
- Branding: Logo prominent vs subtle
Analyzing Results
Key Metrics to Compare
- Revenue per visitor: Total earnings divided by visitors
- Click-through rate: Percentage who click download
- Ad viewability: Percentage of ads actually seen
- Bounce rate: Percentage who leave before download
- Time on page: How long users stay
Statistical Significance
Don’t declare a winner too early. Wait until:
- Each variant has 1,000+ visitors
- Test has run for at least 7 days
- Confidence level reaches 95%+
Common A/B Testing Mistakes
1. Testing Too Many Things at Once
Change only ONE element per test. If you change button color AND timer length, you won’t know which caused the difference.
2. Ending Tests Too Early
Early results can be misleading. A variant might look like a winner on day 1 but lose by day 7. Wait for statistical significance.
3. Ignoring Mobile
Desktop and mobile users behave differently. Segment your results or run separate tests for each device type.
Real-World Test Results
Here are some common findings from A/B tests on safelink pages:
- Green buttons: Often outperform blue by 5-10%
- 8-second timers: Sweet spot for most sites
- Dark backgrounds: Higher ad visibility than light
- File details: Showing file name/size increases trust
Implementing Winners
Once you have a winner:
- Deploy the winning variant to 100% of traffic
- Document what you learned
- Plan your next test
- Monitor for any regression
Conclusion
A/B testing transforms guesswork into data-driven decisions. By systematically testing elements of your safelink pages, you can incrementally improve revenue without risking your entire traffic. Start with one test today – even a 5% improvement adds up over millions of visitors.
Ready to optimize your safelink pages? Get WP Safelink with built-in A/B testing capabilities.
Think your safelink pages are optimized? Without A/B testing, you’re just guessing. This guide shows you how to systematically test and improve your WP Safelink pages for maximum revenue.
What is A/B Testing?
A/B testing (split testing) compares two versions of a page to see which performs better. You show Version A to half your visitors and Version B to the other half, then measure which generates more revenue.
Why A/B Test Safelink Pages?
Small changes can have big impacts on revenue:
- Timer length: 5 seconds vs 10 seconds – which earns more?
- Button color: Green vs blue – which gets more clicks?
- Ad placement: Above countdown vs below – which has higher viewability?
- Page layout: Minimal vs detailed – which converts better?
Setting Up A/B Tests in WP Safelink
Step 1: Create Two Page Variants
In WP Safelink, create two versions of your redirect page with one key difference:
- Go to WP Safelink ??? Templates
- Duplicate your current template
- Modify ONE element (e.g., timer length)
- Save as “Template B”
Step 2: Configure Traffic Split
Set up how traffic is distributed between variants:
- 50/50 split: Standard for most tests
- 90/10 split: For risky changes you want to test safely
- Traffic minimum: Need at least 1,000 visitors per variant for statistical significance
Step 3: Track Results
Monitor these key metrics:
What to Test
1. Countdown Timer Length
Test these common timer lengths:
- Short (3-5 seconds): Higher completion rate, lower ad revenue
- Medium (6-10 seconds): Balanced approach
- Long (15-30 seconds): Higher ad revenue, higher bounce rate
2. Download Button
Test variations of:
- Color: Green, blue, orange, red
- Size: Small, medium, large
- Text: “Download”, “Get File”, “Download Now”, “Click Here”
- Position: Top, center, bottom of page
3. Ad Placement
Test different ad configurations:
- Number of ads: 1 vs 2 vs 3 ad units
- Position: Above content vs below vs sidebar
- Size: Standard sizes vs responsive
- Type: Display vs native vs video
4. Page Design
- Background: Dark vs light theme
- Layout: Centered vs full-width
- Content: Minimal vs detailed file info
- Branding: Logo prominent vs subtle
Analyzing Results
Key Metrics to Compare
- Revenue per visitor: Total earnings divided by visitors
- Click-through rate: Percentage who click download
- Ad viewability: Percentage of ads actually seen
- Bounce rate: Percentage who leave before download
- Time on page: How long users stay
Statistical Significance
Don’t declare a winner too early. Wait until:
- Each variant has 1,000+ visitors
- Test has run for at least 7 days
- Confidence level reaches 95%+
Common A/B Testing Mistakes
1. Testing Too Many Things at Once
Change only ONE element per test. If you change button color AND timer length, you won’t know which caused the difference.
2. Ending Tests Too Early
Early results can be misleading. A variant might look like a winner on day 1 but lose by day 7. Wait for statistical significance.
3. Ignoring Mobile
Desktop and mobile users behave differently. Segment your results or run separate tests for each device type.
Real-World Test Results
Here are some common findings from A/B tests on safelink pages:
- Green buttons: Often outperform blue by 5-10%
- 8-second timers: Sweet spot for most sites
- Dark backgrounds: Higher ad visibility than light
- File details: Showing file name/size increases trust
Implementing Winners
Once you have a winner:
- Deploy the winning variant to 100% of traffic
- Document what you learned
- Plan your next test
- Monitor for any regression
Conclusion
A/B testing transforms guesswork into data-driven decisions. By systematically testing elements of your safelink pages, you can incrementally improve revenue without risking your entire traffic. Start with one test today – even a 5% improvement adds up over millions of visitors.
Ready to optimize your safelink pages? Get WP Safelink with built-in A/B testing capabilities.
Think your safelink pages are optimized? Without A/B testing, you’re just guessing. This guide shows you how to systematically test and improve your WP Safelink pages for maximum revenue.
What is A/B Testing?
A/B testing (split testing) compares two versions of a page to see which performs better. You show Version A to half your visitors and Version B to the other half, then measure which generates more revenue.
Why A/B Test Safelink Pages?
Small changes can have big impacts on revenue:
- Timer length: 5 seconds vs 10 seconds – which earns more?
- Button color: Green vs blue – which gets more clicks?
- Ad placement: Above countdown vs below – which has higher viewability?
- Page layout: Minimal vs detailed – which converts better?
Setting Up A/B Tests in WP Safelink
Step 1: Create Two Page Variants
In WP Safelink, create two versions of your redirect page with one key difference:
- Go to WP Safelink ??? Templates
- Duplicate your current template
- Modify ONE element (e.g., timer length)
- Save as “Template B”
Step 2: Configure Traffic Split
Set up how traffic is distributed between variants:
- 50/50 split: Standard for most tests
- 90/10 split: For risky changes you want to test safely
- Traffic minimum: Need at least 1,000 visitors per variant for statistical significance
Step 3: Track Results
Monitor these key metrics:
What to Test
1. Countdown Timer Length
Test these common timer lengths:
- Short (3-5 seconds): Higher completion rate, lower ad revenue
- Medium (6-10 seconds): Balanced approach
- Long (15-30 seconds): Higher ad revenue, higher bounce rate
2. Download Button
Test variations of:
- Color: Green, blue, orange, red
- Size: Small, medium, large
- Text: “Download”, “Get File”, “Download Now”, “Click Here”
- Position: Top, center, bottom of page
3. Ad Placement
Test different ad configurations:
- Number of ads: 1 vs 2 vs 3 ad units
- Position: Above content vs below vs sidebar
- Size: Standard sizes vs responsive
- Type: Display vs native vs video
4. Page Design
- Background: Dark vs light theme
- Layout: Centered vs full-width
- Content: Minimal vs detailed file info
- Branding: Logo prominent vs subtle
Analyzing Results
Key Metrics to Compare
- Revenue per visitor: Total earnings divided by visitors
- Click-through rate: Percentage who click download
- Ad viewability: Percentage of ads actually seen
- Bounce rate: Percentage who leave before download
- Time on page: How long users stay
Statistical Significance
Don’t declare a winner too early. Wait until:
- Each variant has 1,000+ visitors
- Test has run for at least 7 days
- Confidence level reaches 95%+
Common A/B Testing Mistakes
1. Testing Too Many Things at Once
Change only ONE element per test. If you change button color AND timer length, you won’t know which caused the difference.
2. Ending Tests Too Early
Early results can be misleading. A variant might look like a winner on day 1 but lose by day 7. Wait for statistical significance.
3. Ignoring Mobile
Desktop and mobile users behave differently. Segment your results or run separate tests for each device type.
Real-World Test Results
Here are some common findings from A/B tests on safelink pages:
- Green buttons: Often outperform blue by 5-10%
- 8-second timers: Sweet spot for most sites
- Dark backgrounds: Higher ad visibility than light
- File details: Showing file name/size increases trust
Implementing Winners
Once you have a winner:
- Deploy the winning variant to 100% of traffic
- Document what you learned
- Plan your next test
- Monitor for any regression
Conclusion
A/B testing transforms guesswork into data-driven decisions. By systematically testing elements of your safelink pages, you can incrementally improve revenue without risking your entire traffic. Start with one test today – even a 5% improvement adds up over millions of visitors.
Ready to optimize your safelink pages? Get WP Safelink with built-in A/B testing capabilities.
Think your safelink pages are optimized? Without A/B testing, you’re just guessing. This guide shows you how to systematically test and improve your WP Safelink pages for maximum revenue.
What is A/B Testing?
A/B testing (split testing) compares two versions of a page to see which performs better. You show Version A to half your visitors and Version B to the other half, then measure which generates more revenue.
Why A/B Test Safelink Pages?
Small changes can have big impacts on revenue:
- Timer length: 5 seconds vs 10 seconds – which earns more?
- Button color: Green vs blue – which gets more clicks?
- Ad placement: Above countdown vs below – which has higher viewability?
- Page layout: Minimal vs detailed – which converts better?
Setting Up A/B Tests in WP Safelink
Step 1: Create Two Page Variants
In WP Safelink, create two versions of your redirect page with one key difference:
- Go to WP Safelink ??? Templates
- Duplicate your current template
- Modify ONE element (e.g., timer length)
- Save as “Template B”
Step 2: Configure Traffic Split
Set up how traffic is distributed between variants:
- 50/50 split: Standard for most tests
- 90/10 split: For risky changes you want to test safely
- Traffic minimum: Need at least 1,000 visitors per variant for statistical significance
Step 3: Track Results
Monitor these key metrics:
What to Test
1. Countdown Timer Length
Test these common timer lengths:
- Short (3-5 seconds): Higher completion rate, lower ad revenue
- Medium (6-10 seconds): Balanced approach
- Long (15-30 seconds): Higher ad revenue, higher bounce rate
2. Download Button
Test variations of:
- Color: Green, blue, orange, red
- Size: Small, medium, large
- Text: “Download”, “Get File”, “Download Now”, “Click Here”
- Position: Top, center, bottom of page
3. Ad Placement
Test different ad configurations:
- Number of ads: 1 vs 2 vs 3 ad units
- Position: Above content vs below vs sidebar
- Size: Standard sizes vs responsive
- Type: Display vs native vs video
4. Page Design
- Background: Dark vs light theme
- Layout: Centered vs full-width
- Content: Minimal vs detailed file info
- Branding: Logo prominent vs subtle
Analyzing Results
Key Metrics to Compare
- Revenue per visitor: Total earnings divided by visitors
- Click-through rate: Percentage who click download
- Ad viewability: Percentage of ads actually seen
- Bounce rate: Percentage who leave before download
- Time on page: How long users stay
Statistical Significance
Don’t declare a winner too early. Wait until:
- Each variant has 1,000+ visitors
- Test has run for at least 7 days
- Confidence level reaches 95%+
Common A/B Testing Mistakes
1. Testing Too Many Things at Once
Change only ONE element per test. If you change button color AND timer length, you won’t know which caused the difference.
2. Ending Tests Too Early
Early results can be misleading. A variant might look like a winner on day 1 but lose by day 7. Wait for statistical significance.
3. Ignoring Mobile
Desktop and mobile users behave differently. Segment your results or run separate tests for each device type.
Real-World Test Results
Here are some common findings from A/B tests on safelink pages:
- Green buttons: Often outperform blue by 5-10%
- 8-second timers: Sweet spot for most sites
- Dark backgrounds: Higher ad visibility than light
- File details: Showing file name/size increases trust
Implementing Winners
Once you have a winner:
- Deploy the winning variant to 100% of traffic
- Document what you learned
- Plan your next test
- Monitor for any regression
Conclusion
A/B testing transforms guesswork into data-driven decisions. By systematically testing elements of your safelink pages, you can incrementally improve revenue without risking your entire traffic. Start with one test today – even a 5% improvement adds up over millions of visitors.
Ready to optimize your safelink pages? Get WP Safelink with built-in A/B testing capabilities.
Think your safelink pages are optimized? Without A/B testing, you’re just guessing. This guide shows you how to systematically test and improve your WP Safelink pages for maximum revenue.
What is A/B Testing?
A/B testing (split testing) compares two versions of a page to see which performs better. You show Version A to half your visitors and Version B to the other half, then measure which generates more revenue.
Why A/B Test Safelink Pages?
Small changes can have big impacts on revenue:
- Timer length: 5 seconds vs 10 seconds – which earns more?
- Button color: Green vs blue – which gets more clicks?
- Ad placement: Above countdown vs below – which has higher viewability?
- Page layout: Minimal vs detailed – which converts better?
Setting Up A/B Tests in WP Safelink
Step 1: Create Two Page Variants
In WP Safelink, create two versions of your redirect page with one key difference:
- Go to WP Safelink ??? Templates
- Duplicate your current template
- Modify ONE element (e.g., timer length)
- Save as “Template B”
Step 2: Configure Traffic Split
Set up how traffic is distributed between variants:
- 50/50 split: Standard for most tests
- 90/10 split: For risky changes you want to test safely
- Traffic minimum: Need at least 1,000 visitors per variant for statistical significance
Step 3: Track Results
Monitor these key metrics:
What to Test
1. Countdown Timer Length
Test these common timer lengths:
- Short (3-5 seconds): Higher completion rate, lower ad revenue
- Medium (6-10 seconds): Balanced approach
- Long (15-30 seconds): Higher ad revenue, higher bounce rate
2. Download Button
Test variations of:
- Color: Green, blue, orange, red
- Size: Small, medium, large
- Text: “Download”, “Get File”, “Download Now”, “Click Here”
- Position: Top, center, bottom of page
3. Ad Placement
Test different ad configurations:
- Number of ads: 1 vs 2 vs 3 ad units
- Position: Above content vs below vs sidebar
- Size: Standard sizes vs responsive
- Type: Display vs native vs video
4. Page Design
- Background: Dark vs light theme
- Layout: Centered vs full-width
- Content: Minimal vs detailed file info
- Branding: Logo prominent vs subtle
Analyzing Results
Key Metrics to Compare
- Revenue per visitor: Total earnings divided by visitors
- Click-through rate: Percentage who click download
- Ad viewability: Percentage of ads actually seen
- Bounce rate: Percentage who leave before download
- Time on page: How long users stay
Statistical Significance
Don’t declare a winner too early. Wait until:
- Each variant has 1,000+ visitors
- Test has run for at least 7 days
- Confidence level reaches 95%+
Common A/B Testing Mistakes
1. Testing Too Many Things at Once
Change only ONE element per test. If you change button color AND timer length, you won’t know which caused the difference.
2. Ending Tests Too Early
Early results can be misleading. A variant might look like a winner on day 1 but lose by day 7. Wait for statistical significance.
3. Ignoring Mobile
Desktop and mobile users behave differently. Segment your results or run separate tests for each device type.
Real-World Test Results
Here are some common findings from A/B tests on safelink pages:
- Green buttons: Often outperform blue by 5-10%
- 8-second timers: Sweet spot for most sites
- Dark backgrounds: Higher ad visibility than light
- File details: Showing file name/size increases trust
Implementing Winners
Once you have a winner:
- Deploy the winning variant to 100% of traffic
- Document what you learned
- Plan your next test
- Monitor for any regression
Conclusion
A/B testing transforms guesswork into data-driven decisions. By systematically testing elements of your safelink pages, you can incrementally improve revenue without risking your entire traffic. Start with one test today – even a 5% improvement adds up over millions of visitors.
Ready to optimize your safelink pages? Get WP Safelink with built-in A/B testing capabilities.
What is A/B Testing?
A/B testing (split testing) compares two versions of a page to see which performs better. You show Version A to half your visitors and Version B to the other half, then measure which generates more revenue.
Why A/B Test Safelink Pages?
Small changes can have big impacts on revenue:
- Timer length: 5 seconds vs 10 seconds – which earns more?
- Button color: Green vs blue – which gets more clicks?
- Ad placement: Above countdown vs below – which has higher viewability?
- Page layout: Minimal vs detailed – which converts better?
Setting Up A/B Tests in WP Safelink
Step 1: Create Two Page Variants
In WP Safelink, create two versions of your redirect page with one key difference:
- Go to WP Safelink ??? Templates
- Duplicate your current template
- Modify ONE element (e.g., timer length)
- Save as “Template B”
Step 2: Configure Traffic Split
Set up how traffic is distributed between variants:
- 50/50 split: Standard for most tests
- 90/10 split: For risky changes you want to test safely
- Traffic minimum: Need at least 1,000 visitors per variant for statistical significance
Step 3: Track Results
Monitor these key metrics:
What to Test
1. Countdown Timer Length
Test these common timer lengths:
- Short (3-5 seconds): Higher completion rate, lower ad revenue
- Medium (6-10 seconds): Balanced approach
- Long (15-30 seconds): Higher ad revenue, higher bounce rate
2. Download Button
Test variations of:
- Color: Green, blue, orange, red
- Size: Small, medium, large
- Text: “Download”, “Get File”, “Download Now”, “Click Here”
- Position: Top, center, bottom of page
3. Ad Placement
Test different ad configurations:
- Number of ads: 1 vs 2 vs 3 ad units
- Position: Above content vs below vs sidebar
- Size: Standard sizes vs responsive
- Type: Display vs native vs video
4. Page Design
- Background: Dark vs light theme
- Layout: Centered vs full-width
- Content: Minimal vs detailed file info
- Branding: Logo prominent vs subtle
Analyzing Results
Key Metrics to Compare
- Revenue per visitor: Total earnings divided by visitors
- Click-through rate: Percentage who click download
- Ad viewability: Percentage of ads actually seen
- Bounce rate: Percentage who leave before download
- Time on page: How long users stay
Statistical Significance
Don’t declare a winner too early. Wait until:
- Each variant has 1,000+ visitors
- Test has run for at least 7 days
- Confidence level reaches 95%+
Common A/B Testing Mistakes
1. Testing Too Many Things at Once
Change only ONE element per test. If you change button color AND timer length, you won’t know which caused the difference.
2. Ending Tests Too Early
Early results can be misleading. A variant might look like a winner on day 1 but lose by day 7. Wait for statistical significance.
3. Ignoring Mobile
Desktop and mobile users behave differently. Segment your results or run separate tests for each device type.
Real-World Test Results
Here are some common findings from A/B tests on safelink pages:
- Green buttons: Often outperform blue by 5-10%
- 8-second timers: Sweet spot for most sites
- Dark backgrounds: Higher ad visibility than light
- File details: Showing file name/size increases trust
Implementing Winners
Once you have a winner:
- Deploy the winning variant to 100% of traffic
- Document what you learned
- Plan your next test
- Monitor for any regression
Conclusion
A/B testing transforms guesswork into data-driven decisions. By systematically testing elements of your safelink pages, you can incrementally improve revenue without risking your entire traffic. Start with one test today – even a 5% improvement adds up over millions of visitors.
Ready to optimize your safelink pages? Get WP Safelink with built-in A/B testing capabilities.
Think your safelink pages are optimized? Without A/B testing, you’re just guessing. This guide shows you how to systematically test and improve your WP Safelink pages for maximum revenue.
What is A/B Testing?
A/B testing (split testing) compares two versions of a page to see which performs better. You show Version A to half your visitors and Version B to the other half, then measure which generates more revenue.
Why A/B Test Safelink Pages?
Small changes can have big impacts on revenue:
- Timer length: 5 seconds vs 10 seconds – which earns more?
- Button color: Green vs blue – which gets more clicks?
- Ad placement: Above countdown vs below – which has higher viewability?
- Page layout: Minimal vs detailed – which converts better?
Setting Up A/B Tests in WP Safelink
Step 1: Create Two Page Variants
In WP Safelink, create two versions of your redirect page with one key difference:
- Go to WP Safelink ??? Templates
- Duplicate your current template
- Modify ONE element (e.g., timer length)
- Save as “Template B”
Step 2: Configure Traffic Split
Set up how traffic is distributed between variants:
- 50/50 split: Standard for most tests
- 90/10 split: For risky changes you want to test safely
- Traffic minimum: Need at least 1,000 visitors per variant for statistical significance
Step 3: Track Results
Monitor these key metrics:
What to Test
1. Countdown Timer Length
Test these common timer lengths:
- Short (3-5 seconds): Higher completion rate, lower ad revenue
- Medium (6-10 seconds): Balanced approach
- Long (15-30 seconds): Higher ad revenue, higher bounce rate
2. Download Button
Test variations of:
- Color: Green, blue, orange, red
- Size: Small, medium, large
- Text: “Download”, “Get File”, “Download Now”, “Click Here”
- Position: Top, center, bottom of page
3. Ad Placement
Test different ad configurations:
- Number of ads: 1 vs 2 vs 3 ad units
- Position: Above content vs below vs sidebar
- Size: Standard sizes vs responsive
- Type: Display vs native vs video
4. Page Design
- Background: Dark vs light theme
- Layout: Centered vs full-width
- Content: Minimal vs detailed file info
- Branding: Logo prominent vs subtle
Analyzing Results
Key Metrics to Compare
- Revenue per visitor: Total earnings divided by visitors
- Click-through rate: Percentage who click download
- Ad viewability: Percentage of ads actually seen
- Bounce rate: Percentage who leave before download
- Time on page: How long users stay
Statistical Significance
Don’t declare a winner too early. Wait until:
- Each variant has 1,000+ visitors
- Test has run for at least 7 days
- Confidence level reaches 95%+
Common A/B Testing Mistakes
1. Testing Too Many Things at Once
Change only ONE element per test. If you change button color AND timer length, you won’t know which caused the difference.
2. Ending Tests Too Early
Early results can be misleading. A variant might look like a winner on day 1 but lose by day 7. Wait for statistical significance.
3. Ignoring Mobile
Desktop and mobile users behave differently. Segment your results or run separate tests for each device type.
Real-World Test Results
Here are some common findings from A/B tests on safelink pages:
- Green buttons: Often outperform blue by 5-10%
- 8-second timers: Sweet spot for most sites
- Dark backgrounds: Higher ad visibility than light
- File details: Showing file name/size increases trust
Implementing Winners
Once you have a winner:
- Deploy the winning variant to 100% of traffic
- Document what you learned
- Plan your next test
- Monitor for any regression
Conclusion
A/B testing transforms guesswork into data-driven decisions. By systematically testing elements of your safelink pages, you can incrementally improve revenue without risking your entire traffic. Start with one test today – even a 5% improvement adds up over millions of visitors.
Ready to optimize your safelink pages? Get WP Safelink with built-in A/B testing capabilities.
What is A/B Testing?
A/B testing (split testing) compares two versions of a page to see which performs better. You show Version A to half your visitors and Version B to the other half, then measure which generates more revenue.
Why A/B Test Safelink Pages?
Small changes can have big impacts on revenue:
- Timer length: 5 seconds vs 10 seconds – which earns more?
- Button color: Green vs blue – which gets more clicks?
- Ad placement: Above countdown vs below – which has higher viewability?
- Page layout: Minimal vs detailed – which converts better?
Setting Up A/B Tests in WP Safelink
Step 1: Create Two Page Variants
In WP Safelink, create two versions of your redirect page with one key difference:
- Go to WP Safelink ??? Templates
- Duplicate your current template
- Modify ONE element (e.g., timer length)
- Save as “Template B”
Step 2: Configure Traffic Split
Set up how traffic is distributed between variants:
- 50/50 split: Standard for most tests
- 90/10 split: For risky changes you want to test safely
- Traffic minimum: Need at least 1,000 visitors per variant for statistical significance
Step 3: Track Results
Monitor these key metrics:
What to Test
1. Countdown Timer Length
Test these common timer lengths:
- Short (3-5 seconds): Higher completion rate, lower ad revenue
- Medium (6-10 seconds): Balanced approach
- Long (15-30 seconds): Higher ad revenue, higher bounce rate
2. Download Button
Test variations of:
- Color: Green, blue, orange, red
- Size: Small, medium, large
- Text: “Download”, “Get File”, “Download Now”, “Click Here”
- Position: Top, center, bottom of page
3. Ad Placement
Test different ad configurations:
- Number of ads: 1 vs 2 vs 3 ad units
- Position: Above content vs below vs sidebar
- Size: Standard sizes vs responsive
- Type: Display vs native vs video
4. Page Design
- Background: Dark vs light theme
- Layout: Centered vs full-width
- Content: Minimal vs detailed file info
- Branding: Logo prominent vs subtle
Analyzing Results
Key Metrics to Compare
- Revenue per visitor: Total earnings divided by visitors
- Click-through rate: Percentage who click download
- Ad viewability: Percentage of ads actually seen
- Bounce rate: Percentage who leave before download
- Time on page: How long users stay
Statistical Significance
Don’t declare a winner too early. Wait until:
- Each variant has 1,000+ visitors
- Test has run for at least 7 days
- Confidence level reaches 95%+
Common A/B Testing Mistakes
1. Testing Too Many Things at Once
Change only ONE element per test. If you change button color AND timer length, you won’t know which caused the difference.
2. Ending Tests Too Early
Early results can be misleading. A variant might look like a winner on day 1 but lose by day 7. Wait for statistical significance.
3. Ignoring Mobile
Desktop and mobile users behave differently. Segment your results or run separate tests for each device type.
Real-World Test Results
Here are some common findings from A/B tests on safelink pages:
- Green buttons: Often outperform blue by 5-10%
- 8-second timers: Sweet spot for most sites
- Dark backgrounds: Higher ad visibility than light
- File details: Showing file name/size increases trust
Implementing Winners
Once you have a winner:
- Deploy the winning variant to 100% of traffic
- Document what you learned
- Plan your next test
- Monitor for any regression
Conclusion
A/B testing transforms guesswork into data-driven decisions. By systematically testing elements of your safelink pages, you can incrementally improve revenue without risking your entire traffic. Start with one test today – even a 5% improvement adds up over millions of visitors.
Ready to optimize your safelink pages? Get WP Safelink with built-in A/B testing capabilities.
Think your safelink pages are optimized? Without A/B testing, you’re just guessing. This guide shows you how to systematically test and improve your WP Safelink pages for maximum revenue.
What is A/B Testing?
A/B testing (split testing) compares two versions of a page to see which performs better. You show Version A to half your visitors and Version B to the other half, then measure which generates more revenue.
Why A/B Test Safelink Pages?
Small changes can have big impacts on revenue:
- Timer length: 5 seconds vs 10 seconds – which earns more?
- Button color: Green vs blue – which gets more clicks?
- Ad placement: Above countdown vs below – which has higher viewability?
- Page layout: Minimal vs detailed – which converts better?
Setting Up A/B Tests in WP Safelink
Step 1: Create Two Page Variants
In WP Safelink, create two versions of your redirect page with one key difference:
- Go to WP Safelink ??? Templates
- Duplicate your current template
- Modify ONE element (e.g., timer length)
- Save as “Template B”
Step 2: Configure Traffic Split
Set up how traffic is distributed between variants:
- 50/50 split: Standard for most tests
- 90/10 split: For risky changes you want to test safely
- Traffic minimum: Need at least 1,000 visitors per variant for statistical significance
Step 3: Track Results
Monitor these key metrics:
What to Test
1. Countdown Timer Length
Test these common timer lengths:
- Short (3-5 seconds): Higher completion rate, lower ad revenue
- Medium (6-10 seconds): Balanced approach
- Long (15-30 seconds): Higher ad revenue, higher bounce rate
2. Download Button
Test variations of:
- Color: Green, blue, orange, red
- Size: Small, medium, large
- Text: “Download”, “Get File”, “Download Now”, “Click Here”
- Position: Top, center, bottom of page
3. Ad Placement
Test different ad configurations:
- Number of ads: 1 vs 2 vs 3 ad units
- Position: Above content vs below vs sidebar
- Size: Standard sizes vs responsive
- Type: Display vs native vs video
4. Page Design
- Background: Dark vs light theme
- Layout: Centered vs full-width
- Content: Minimal vs detailed file info
- Branding: Logo prominent vs subtle
Analyzing Results
Key Metrics to Compare
- Revenue per visitor: Total earnings divided by visitors
- Click-through rate: Percentage who click download
- Ad viewability: Percentage of ads actually seen
- Bounce rate: Percentage who leave before download
- Time on page: How long users stay
Statistical Significance
Don’t declare a winner too early. Wait until:
- Each variant has 1,000+ visitors
- Test has run for at least 7 days
- Confidence level reaches 95%+
Common A/B Testing Mistakes
1. Testing Too Many Things at Once
Change only ONE element per test. If you change button color AND timer length, you won’t know which caused the difference.
2. Ending Tests Too Early
Early results can be misleading. A variant might look like a winner on day 1 but lose by day 7. Wait for statistical significance.
3. Ignoring Mobile
Desktop and mobile users behave differently. Segment your results or run separate tests for each device type.
Real-World Test Results
Here are some common findings from A/B tests on safelink pages:
- Green buttons: Often outperform blue by 5-10%
- 8-second timers: Sweet spot for most sites
- Dark backgrounds: Higher ad visibility than light
- File details: Showing file name/size increases trust
Implementing Winners
Once you have a winner:
- Deploy the winning variant to 100% of traffic
- Document what you learned
- Plan your next test
- Monitor for any regression
Conclusion
A/B testing transforms guesswork into data-driven decisions. By systematically testing elements of your safelink pages, you can incrementally improve revenue without risking your entire traffic. Start with one test today – even a 5% improvement adds up over millions of visitors.
Ready to optimize your safelink pages? Get WP Safelink with built-in A/B testing capabilities.
What is A/B Testing?
A/B testing (split testing) compares two versions of a page to see which performs better. You show Version A to half your visitors and Version B to the other half, then measure which generates more revenue.
Why A/B Test Safelink Pages?
Small changes can have big impacts on revenue:
- Timer length: 5 seconds vs 10 seconds – which earns more?
- Button color: Green vs blue – which gets more clicks?
- Ad placement: Above countdown vs below – which has higher viewability?
- Page layout: Minimal vs detailed – which converts better?
Setting Up A/B Tests in WP Safelink
Step 1: Create Two Page Variants
In WP Safelink, create two versions of your redirect page with one key difference:
- Go to WP Safelink ??? Templates
- Duplicate your current template
- Modify ONE element (e.g., timer length)
- Save as “Template B”
Step 2: Configure Traffic Split
Set up how traffic is distributed between variants:
- 50/50 split: Standard for most tests
- 90/10 split: For risky changes you want to test safely
- Traffic minimum: Need at least 1,000 visitors per variant for statistical significance
Step 3: Track Results
Monitor these key metrics:
What to Test
1. Countdown Timer Length
Test these common timer lengths:
- Short (3-5 seconds): Higher completion rate, lower ad revenue
- Medium (6-10 seconds): Balanced approach
- Long (15-30 seconds): Higher ad revenue, higher bounce rate
2. Download Button
Test variations of:
- Color: Green, blue, orange, red
- Size: Small, medium, large
- Text: “Download”, “Get File”, “Download Now”, “Click Here”
- Position: Top, center, bottom of page
3. Ad Placement
Test different ad configurations:
- Number of ads: 1 vs 2 vs 3 ad units
- Position: Above content vs below vs sidebar
- Size: Standard sizes vs responsive
- Type: Display vs native vs video
4. Page Design
- Background: Dark vs light theme
- Layout: Centered vs full-width
- Content: Minimal vs detailed file info
- Branding: Logo prominent vs subtle
Analyzing Results
Key Metrics to Compare
- Revenue per visitor: Total earnings divided by visitors
- Click-through rate: Percentage who click download
- Ad viewability: Percentage of ads actually seen
- Bounce rate: Percentage who leave before download
- Time on page: How long users stay
Statistical Significance
Don’t declare a winner too early. Wait until:
- Each variant has 1,000+ visitors
- Test has run for at least 7 days
- Confidence level reaches 95%+
Common A/B Testing Mistakes
1. Testing Too Many Things at Once
Change only ONE element per test. If you change button color AND timer length, you won’t know which caused the difference.
2. Ending Tests Too Early
Early results can be misleading. A variant might look like a winner on day 1 but lose by day 7. Wait for statistical significance.
3. Ignoring Mobile
Desktop and mobile users behave differently. Segment your results or run separate tests for each device type.
Real-World Test Results
Here are some common findings from A/B tests on safelink pages:
- Green buttons: Often outperform blue by 5-10%
- 8-second timers: Sweet spot for most sites
- Dark backgrounds: Higher ad visibility than light
- File details: Showing file name/size increases trust
Implementing Winners
Once you have a winner:
- Deploy the winning variant to 100% of traffic
- Document what you learned
- Plan your next test
- Monitor for any regression
Conclusion
A/B testing transforms guesswork into data-driven decisions. By systematically testing elements of your safelink pages, you can incrementally improve revenue without risking your entire traffic. Start with one test today – even a 5% improvement adds up over millions of visitors.
Ready to optimize your safelink pages? Get WP Safelink with built-in A/B testing capabilities.
Think your safelink pages are optimized? Without A/B testing, you’re just guessing. This guide shows you how to systematically test and improve your WP Safelink pages for maximum revenue.
What is A/B Testing?
A/B testing (split testing) compares two versions of a page to see which performs better. You show Version A to half your visitors and Version B to the other half, then measure which generates more revenue.
Why A/B Test Safelink Pages?
Small changes can have big impacts on revenue:
- Timer length: 5 seconds vs 10 seconds – which earns more?
- Button color: Green vs blue – which gets more clicks?
- Ad placement: Above countdown vs below – which has higher viewability?
- Page layout: Minimal vs detailed – which converts better?
Setting Up A/B Tests in WP Safelink
Step 1: Create Two Page Variants
In WP Safelink, create two versions of your redirect page with one key difference:
- Go to WP Safelink ??? Templates
- Duplicate your current template
- Modify ONE element (e.g., timer length)
- Save as “Template B”
Step 2: Configure Traffic Split
Set up how traffic is distributed between variants:
- 50/50 split: Standard for most tests
- 90/10 split: For risky changes you want to test safely
- Traffic minimum: Need at least 1,000 visitors per variant for statistical significance
Step 3: Track Results
Monitor these key metrics:
What to Test
1. Countdown Timer Length
Test these common timer lengths:
- Short (3-5 seconds): Higher completion rate, lower ad revenue
- Medium (6-10 seconds): Balanced approach
- Long (15-30 seconds): Higher ad revenue, higher bounce rate
2. Download Button
Test variations of:
- Color: Green, blue, orange, red
- Size: Small, medium, large
- Text: “Download”, “Get File”, “Download Now”, “Click Here”
- Position: Top, center, bottom of page
3. Ad Placement
Test different ad configurations:
- Number of ads: 1 vs 2 vs 3 ad units
- Position: Above content vs below vs sidebar
- Size: Standard sizes vs responsive
- Type: Display vs native vs video
4. Page Design
- Background: Dark vs light theme
- Layout: Centered vs full-width
- Content: Minimal vs detailed file info
- Branding: Logo prominent vs subtle
Analyzing Results
Key Metrics to Compare
- Revenue per visitor: Total earnings divided by visitors
- Click-through rate: Percentage who click download
- Ad viewability: Percentage of ads actually seen
- Bounce rate: Percentage who leave before download
- Time on page: How long users stay
Statistical Significance
Don’t declare a winner too early. Wait until:
- Each variant has 1,000+ visitors
- Test has run for at least 7 days
- Confidence level reaches 95%+
Common A/B Testing Mistakes
1. Testing Too Many Things at Once
Change only ONE element per test. If you change button color AND timer length, you won’t know which caused the difference.
2. Ending Tests Too Early
Early results can be misleading. A variant might look like a winner on day 1 but lose by day 7. Wait for statistical significance.
3. Ignoring Mobile
Desktop and mobile users behave differently. Segment your results or run separate tests for each device type.
Real-World Test Results
Here are some common findings from A/B tests on safelink pages:
- Green buttons: Often outperform blue by 5-10%
- 8-second timers: Sweet spot for most sites
- Dark backgrounds: Higher ad visibility than light
- File details: Showing file name/size increases trust
Implementing Winners
Once you have a winner:
- Deploy the winning variant to 100% of traffic
- Document what you learned
- Plan your next test
- Monitor for any regression
Conclusion
A/B testing transforms guesswork into data-driven decisions. By systematically testing elements of your safelink pages, you can incrementally improve revenue without risking your entire traffic. Start with one test today – even a 5% improvement adds up over millions of visitors.
Ready to optimize your safelink pages? Get WP Safelink with built-in A/B testing capabilities.
What is A/B Testing?
A/B testing (split testing) compares two versions of a page to see which performs better. You show Version A to half your visitors and Version B to the other half, then measure which generates more revenue.
Why A/B Test Safelink Pages?
Small changes can have big impacts on revenue:
- Timer length: 5 seconds vs 10 seconds – which earns more?
- Button color: Green vs blue – which gets more clicks?
- Ad placement: Above countdown vs below – which has higher viewability?
- Page layout: Minimal vs detailed – which converts better?
Setting Up A/B Tests in WP Safelink
Step 1: Create Two Page Variants
In WP Safelink, create two versions of your redirect page with one key difference:
- Go to WP Safelink ??? Templates
- Duplicate your current template
- Modify ONE element (e.g., timer length)
- Save as “Template B”
Step 2: Configure Traffic Split
Set up how traffic is distributed between variants:
- 50/50 split: Standard for most tests
- 90/10 split: For risky changes you want to test safely
- Traffic minimum: Need at least 1,000 visitors per variant for statistical significance
Step 3: Track Results
Monitor these key metrics:
What to Test
1. Countdown Timer Length
Test these common timer lengths:
- Short (3-5 seconds): Higher completion rate, lower ad revenue
- Medium (6-10 seconds): Balanced approach
- Long (15-30 seconds): Higher ad revenue, higher bounce rate
2. Download Button
Test variations of:
- Color: Green, blue, orange, red
- Size: Small, medium, large
- Text: “Download”, “Get File”, “Download Now”, “Click Here”
- Position: Top, center, bottom of page
3. Ad Placement
Test different ad configurations:
- Number of ads: 1 vs 2 vs 3 ad units
- Position: Above content vs below vs sidebar
- Size: Standard sizes vs responsive
- Type: Display vs native vs video
4. Page Design
- Background: Dark vs light theme
- Layout: Centered vs full-width
- Content: Minimal vs detailed file info
- Branding: Logo prominent vs subtle
Analyzing Results
Key Metrics to Compare
- Revenue per visitor: Total earnings divided by visitors
- Click-through rate: Percentage who click download
- Ad viewability: Percentage of ads actually seen
- Bounce rate: Percentage who leave before download
- Time on page: How long users stay
Statistical Significance
Don’t declare a winner too early. Wait until:
- Each variant has 1,000+ visitors
- Test has run for at least 7 days
- Confidence level reaches 95%+
Common A/B Testing Mistakes
1. Testing Too Many Things at Once
Change only ONE element per test. If you change button color AND timer length, you won’t know which caused the difference.
2. Ending Tests Too Early
Early results can be misleading. A variant might look like a winner on day 1 but lose by day 7. Wait for statistical significance.
3. Ignoring Mobile
Desktop and mobile users behave differently. Segment your results or run separate tests for each device type.
Real-World Test Results
Here are some common findings from A/B tests on safelink pages:
- Green buttons: Often outperform blue by 5-10%
- 8-second timers: Sweet spot for most sites
- Dark backgrounds: Higher ad visibility than light
- File details: Showing file name/size increases trust
Implementing Winners
Once you have a winner:
- Deploy the winning variant to 100% of traffic
- Document what you learned
- Plan your next test
- Monitor for any regression
Conclusion
A/B testing transforms guesswork into data-driven decisions. By systematically testing elements of your safelink pages, you can incrementally improve revenue without risking your entire traffic. Start with one test today – even a 5% improvement adds up over millions of visitors.
Ready to optimize your safelink pages? Get WP Safelink with built-in A/B testing capabilities.
Think your safelink pages are optimized? Without A/B testing, you’re just guessing. This guide shows you how to systematically test and improve your WP Safelink pages for maximum revenue.
What is A/B Testing?
A/B testing (split testing) compares two versions of a page to see which performs better. You show Version A to half your visitors and Version B to the other half, then measure which generates more revenue.
Why A/B Test Safelink Pages?
Small changes can have big impacts on revenue:
- Timer length: 5 seconds vs 10 seconds – which earns more?
- Button color: Green vs blue – which gets more clicks?
- Ad placement: Above countdown vs below – which has higher viewability?
- Page layout: Minimal vs detailed – which converts better?
Setting Up A/B Tests in WP Safelink
Step 1: Create Two Page Variants
In WP Safelink, create two versions of your redirect page with one key difference:
- Go to WP Safelink ??? Templates
- Duplicate your current template
- Modify ONE element (e.g., timer length)
- Save as “Template B”
Step 2: Configure Traffic Split
Set up how traffic is distributed between variants:
- 50/50 split: Standard for most tests
- 90/10 split: For risky changes you want to test safely
- Traffic minimum: Need at least 1,000 visitors per variant for statistical significance
Step 3: Track Results
Monitor these key metrics:
What to Test
1. Countdown Timer Length
Test these common timer lengths:
- Short (3-5 seconds): Higher completion rate, lower ad revenue
- Medium (6-10 seconds): Balanced approach
- Long (15-30 seconds): Higher ad revenue, higher bounce rate
2. Download Button
Test variations of:
- Color: Green, blue, orange, red
- Size: Small, medium, large
- Text: “Download”, “Get File”, “Download Now”, “Click Here”
- Position: Top, center, bottom of page
3. Ad Placement
Test different ad configurations:
- Number of ads: 1 vs 2 vs 3 ad units
- Position: Above content vs below vs sidebar
- Size: Standard sizes vs responsive
- Type: Display vs native vs video
4. Page Design
- Background: Dark vs light theme
- Layout: Centered vs full-width
- Content: Minimal vs detailed file info
- Branding: Logo prominent vs subtle
Analyzing Results
Key Metrics to Compare
- Revenue per visitor: Total earnings divided by visitors
- Click-through rate: Percentage who click download
- Ad viewability: Percentage of ads actually seen
- Bounce rate: Percentage who leave before download
- Time on page: How long users stay
Statistical Significance
Don’t declare a winner too early. Wait until:
- Each variant has 1,000+ visitors
- Test has run for at least 7 days
- Confidence level reaches 95%+
Common A/B Testing Mistakes
1. Testing Too Many Things at Once
Change only ONE element per test. If you change button color AND timer length, you won’t know which caused the difference.
2. Ending Tests Too Early
Early results can be misleading. A variant might look like a winner on day 1 but lose by day 7. Wait for statistical significance.
3. Ignoring Mobile
Desktop and mobile users behave differently. Segment your results or run separate tests for each device type.
Real-World Test Results
Here are some common findings from A/B tests on safelink pages:
- Green buttons: Often outperform blue by 5-10%
- 8-second timers: Sweet spot for most sites
- Dark backgrounds: Higher ad visibility than light
- File details: Showing file name/size increases trust
Implementing Winners
Once you have a winner:
- Deploy the winning variant to 100% of traffic
- Document what you learned
- Plan your next test
- Monitor for any regression
Conclusion
A/B testing transforms guesswork into data-driven decisions. By systematically testing elements of your safelink pages, you can incrementally improve revenue without risking your entire traffic. Start with one test today – even a 5% improvement adds up over millions of visitors.
Ready to optimize your safelink pages? Get WP Safelink with built-in A/B testing capabilities.
What to Test
1. Countdown Timer Length
Test these common timer lengths:
- Short (3-5 seconds): Higher completion rate, lower ad revenue
- Medium (6-10 seconds): Balanced approach
- Long (15-30 seconds): Higher ad revenue, higher bounce rate
2. Download Button
Test variations of:
- Color: Green, blue, orange, red
- Size: Small, medium, large
- Text: “Download”, “Get File”, “Download Now”, “Click Here”
- Position: Top, center, bottom of page
3. Ad Placement
Test different ad configurations:
- Number of ads: 1 vs 2 vs 3 ad units
- Position: Above content vs below vs sidebar
- Size: Standard sizes vs responsive
- Type: Display vs native vs video
4. Page Design
- Background: Dark vs light theme
- Layout: Centered vs full-width
- Content: Minimal vs detailed file info
- Branding: Logo prominent vs subtle
Analyzing Results
Key Metrics to Compare
- Revenue per visitor: Total earnings divided by visitors
- Click-through rate: Percentage who click download
- Ad viewability: Percentage of ads actually seen
- Bounce rate: Percentage who leave before download
- Time on page: How long users stay
Statistical Significance
Don’t declare a winner too early. Wait until:
- Each variant has 1,000+ visitors
- Test has run for at least 7 days
- Confidence level reaches 95%+
Common A/B Testing Mistakes
1. Testing Too Many Things at Once
Change only ONE element per test. If you change button color AND timer length, you won’t know which caused the difference.
2. Ending Tests Too Early
Early results can be misleading. A variant might look like a winner on day 1 but lose by day 7. Wait for statistical significance.
3. Ignoring Mobile
Desktop and mobile users behave differently. Segment your results or run separate tests for each device type.
Real-World Test Results
Here are some common findings from A/B tests on safelink pages:
- Green buttons: Often outperform blue by 5-10%
- 8-second timers: Sweet spot for most sites
- Dark backgrounds: Higher ad visibility than light
- File details: Showing file name/size increases trust
Implementing Winners
Once you have a winner:
- Deploy the winning variant to 100% of traffic
- Document what you learned
- Plan your next test
- Monitor for any regression
Conclusion
A/B testing transforms guesswork into data-driven decisions. By systematically testing elements of your safelink pages, you can incrementally improve revenue without risking your entire traffic. Start with one test today – even a 5% improvement adds up over millions of visitors.
Ready to optimize your safelink pages? Get WP Safelink with built-in A/B testing capabilities.
What is A/B Testing?
A/B testing (split testing) compares two versions of a page to see which performs better. You show Version A to half your visitors and Version B to the other half, then measure which generates more revenue.
Why A/B Test Safelink Pages?
Small changes can have big impacts on revenue:
- Timer length: 5 seconds vs 10 seconds – which earns more?
- Button color: Green vs blue – which gets more clicks?
- Ad placement: Above countdown vs below – which has higher viewability?
- Page layout: Minimal vs detailed – which converts better?
Setting Up A/B Tests in WP Safelink
Step 1: Create Two Page Variants
In WP Safelink, create two versions of your redirect page with one key difference:
- Go to WP Safelink ??? Templates
- Duplicate your current template
- Modify ONE element (e.g., timer length)
- Save as “Template B”
Step 2: Configure Traffic Split
Set up how traffic is distributed between variants:
- 50/50 split: Standard for most tests
- 90/10 split: For risky changes you want to test safely
- Traffic minimum: Need at least 1,000 visitors per variant for statistical significance
Step 3: Track Results
Monitor these key metrics:
What to Test
1. Countdown Timer Length
Test these common timer lengths:
- Short (3-5 seconds): Higher completion rate, lower ad revenue
- Medium (6-10 seconds): Balanced approach
- Long (15-30 seconds): Higher ad revenue, higher bounce rate
2. Download Button
Test variations of:
- Color: Green, blue, orange, red
- Size: Small, medium, large
- Text: “Download”, “Get File”, “Download Now”, “Click Here”
- Position: Top, center, bottom of page
3. Ad Placement
Test different ad configurations:
- Number of ads: 1 vs 2 vs 3 ad units
- Position: Above content vs below vs sidebar
- Size: Standard sizes vs responsive
- Type: Display vs native vs video
4. Page Design
- Background: Dark vs light theme
- Layout: Centered vs full-width
- Content: Minimal vs detailed file info
- Branding: Logo prominent vs subtle
Analyzing Results
Key Metrics to Compare
- Revenue per visitor: Total earnings divided by visitors
- Click-through rate: Percentage who click download
- Ad viewability: Percentage of ads actually seen
- Bounce rate: Percentage who leave before download
- Time on page: How long users stay
Statistical Significance
Don’t declare a winner too early. Wait until:
- Each variant has 1,000+ visitors
- Test has run for at least 7 days
- Confidence level reaches 95%+
Common A/B Testing Mistakes
1. Testing Too Many Things at Once
Change only ONE element per test. If you change button color AND timer length, you won’t know which caused the difference.
2. Ending Tests Too Early
Early results can be misleading. A variant might look like a winner on day 1 but lose by day 7. Wait for statistical significance.
3. Ignoring Mobile
Desktop and mobile users behave differently. Segment your results or run separate tests for each device type.
Real-World Test Results
Here are some common findings from A/B tests on safelink pages:
- Green buttons: Often outperform blue by 5-10%
- 8-second timers: Sweet spot for most sites
- Dark backgrounds: Higher ad visibility than light
- File details: Showing file name/size increases trust
Implementing Winners
Once you have a winner:
- Deploy the winning variant to 100% of traffic
- Document what you learned
- Plan your next test
- Monitor for any regression
Conclusion
A/B testing transforms guesswork into data-driven decisions. By systematically testing elements of your safelink pages, you can incrementally improve revenue without risking your entire traffic. Start with one test today – even a 5% improvement adds up over millions of visitors.
Ready to optimize your safelink pages? Get WP Safelink with built-in A/B testing capabilities.
Think your safelink pages are optimized? Without A/B testing, you’re just guessing. This guide shows you how to systematically test and improve your WP Safelink pages for maximum revenue.
What is A/B Testing?
A/B testing (split testing) compares two versions of a page to see which performs better. You show Version A to half your visitors and Version B to the other half, then measure which generates more revenue.
Why A/B Test Safelink Pages?
Small changes can have big impacts on revenue:
- Timer length: 5 seconds vs 10 seconds – which earns more?
- Button color: Green vs blue – which gets more clicks?
- Ad placement: Above countdown vs below – which has higher viewability?
- Page layout: Minimal vs detailed – which converts better?
Setting Up A/B Tests in WP Safelink
Step 1: Create Two Page Variants
In WP Safelink, create two versions of your redirect page with one key difference:
- Go to WP Safelink ??? Templates
- Duplicate your current template
- Modify ONE element (e.g., timer length)
- Save as “Template B”
Step 2: Configure Traffic Split
Set up how traffic is distributed between variants:
- 50/50 split: Standard for most tests
- 90/10 split: For risky changes you want to test safely
- Traffic minimum: Need at least 1,000 visitors per variant for statistical significance
Step 3: Track Results
Monitor these key metrics:
What to Test
1. Countdown Timer Length
Test these common timer lengths:
- Short (3-5 seconds): Higher completion rate, lower ad revenue
- Medium (6-10 seconds): Balanced approach
- Long (15-30 seconds): Higher ad revenue, higher bounce rate
2. Download Button
Test variations of:
- Color: Green, blue, orange, red
- Size: Small, medium, large
- Text: “Download”, “Get File”, “Download Now”, “Click Here”
- Position: Top, center, bottom of page
3. Ad Placement
Test different ad configurations:
- Number of ads: 1 vs 2 vs 3 ad units
- Position: Above content vs below vs sidebar
- Size: Standard sizes vs responsive
- Type: Display vs native vs video
4. Page Design
- Background: Dark vs light theme
- Layout: Centered vs full-width
- Content: Minimal vs detailed file info
- Branding: Logo prominent vs subtle
Analyzing Results
Key Metrics to Compare
- Revenue per visitor: Total earnings divided by visitors
- Click-through rate: Percentage who click download
- Ad viewability: Percentage of ads actually seen
- Bounce rate: Percentage who leave before download
- Time on page: How long users stay
Statistical Significance
Don’t declare a winner too early. Wait until:
- Each variant has 1,000+ visitors
- Test has run for at least 7 days
- Confidence level reaches 95%+
Common A/B Testing Mistakes
1. Testing Too Many Things at Once
Change only ONE element per test. If you change button color AND timer length, you won’t know which caused the difference.
2. Ending Tests Too Early
Early results can be misleading. A variant might look like a winner on day 1 but lose by day 7. Wait for statistical significance.
3. Ignoring Mobile
Desktop and mobile users behave differently. Segment your results or run separate tests for each device type.
Real-World Test Results
Here are some common findings from A/B tests on safelink pages:
- Green buttons: Often outperform blue by 5-10%
- 8-second timers: Sweet spot for most sites
- Dark backgrounds: Higher ad visibility than light
- File details: Showing file name/size increases trust
Implementing Winners
Once you have a winner:
- Deploy the winning variant to 100% of traffic
- Document what you learned
- Plan your next test
- Monitor for any regression
Conclusion
A/B testing transforms guesswork into data-driven decisions. By systematically testing elements of your safelink pages, you can incrementally improve revenue without risking your entire traffic. Start with one test today – even a 5% improvement adds up over millions of visitors.
Ready to optimize your safelink pages? Get WP Safelink with built-in A/B testing capabilities.
What to Test
1. Countdown Timer Length
Test these common timer lengths:
- Short (3-5 seconds): Higher completion rate, lower ad revenue
- Medium (6-10 seconds): Balanced approach
- Long (15-30 seconds): Higher ad revenue, higher bounce rate
2. Download Button
Test variations of:
- Color: Green, blue, orange, red
- Size: Small, medium, large
- Text: “Download”, “Get File”, “Download Now”, “Click Here”
- Position: Top, center, bottom of page
3. Ad Placement
Test different ad configurations:
- Number of ads: 1 vs 2 vs 3 ad units
- Position: Above content vs below vs sidebar
- Size: Standard sizes vs responsive
- Type: Display vs native vs video
4. Page Design
- Background: Dark vs light theme
- Layout: Centered vs full-width
- Content: Minimal vs detailed file info
- Branding: Logo prominent vs subtle
Analyzing Results
Key Metrics to Compare
- Revenue per visitor: Total earnings divided by visitors
- Click-through rate: Percentage who click download
- Ad viewability: Percentage of ads actually seen
- Bounce rate: Percentage who leave before download
- Time on page: How long users stay
Statistical Significance
Don’t declare a winner too early. Wait until:
- Each variant has 1,000+ visitors
- Test has run for at least 7 days
- Confidence level reaches 95%+
Common A/B Testing Mistakes
1. Testing Too Many Things at Once
Change only ONE element per test. If you change button color AND timer length, you won’t know which caused the difference.
2. Ending Tests Too Early
Early results can be misleading. A variant might look like a winner on day 1 but lose by day 7. Wait for statistical significance.
3. Ignoring Mobile
Desktop and mobile users behave differently. Segment your results or run separate tests for each device type.
Real-World Test Results
Here are some common findings from A/B tests on safelink pages:
- Green buttons: Often outperform blue by 5-10%
- 8-second timers: Sweet spot for most sites
- Dark backgrounds: Higher ad visibility than light
- File details: Showing file name/size increases trust
Implementing Winners
Once you have a winner:
- Deploy the winning variant to 100% of traffic
- Document what you learned
- Plan your next test
- Monitor for any regression
Conclusion
A/B testing transforms guesswork into data-driven decisions. By systematically testing elements of your safelink pages, you can incrementally improve revenue without risking your entire traffic. Start with one test today – even a 5% improvement adds up over millions of visitors.
Ready to optimize your safelink pages? Get WP Safelink with built-in A/B testing capabilities.
What is A/B Testing?
A/B testing (split testing) compares two versions of a page to see which performs better. You show Version A to half your visitors and Version B to the other half, then measure which generates more revenue.
Why A/B Test Safelink Pages?
Small changes can have big impacts on revenue:
- Timer length: 5 seconds vs 10 seconds – which earns more?
- Button color: Green vs blue – which gets more clicks?
- Ad placement: Above countdown vs below – which has higher viewability?
- Page layout: Minimal vs detailed – which converts better?
Setting Up A/B Tests in WP Safelink
Step 1: Create Two Page Variants
In WP Safelink, create two versions of your redirect page with one key difference:
- Go to WP Safelink ??? Templates
- Duplicate your current template
- Modify ONE element (e.g., timer length)
- Save as “Template B”
Step 2: Configure Traffic Split
Set up how traffic is distributed between variants:
- 50/50 split: Standard for most tests
- 90/10 split: For risky changes you want to test safely
- Traffic minimum: Need at least 1,000 visitors per variant for statistical significance
Step 3: Track Results
Monitor these key metrics:
What to Test
1. Countdown Timer Length
Test these common timer lengths:
- Short (3-5 seconds): Higher completion rate, lower ad revenue
- Medium (6-10 seconds): Balanced approach
- Long (15-30 seconds): Higher ad revenue, higher bounce rate
2. Download Button
Test variations of:
- Color: Green, blue, orange, red
- Size: Small, medium, large
- Text: “Download”, “Get File”, “Download Now”, “Click Here”
- Position: Top, center, bottom of page
3. Ad Placement
Test different ad configurations:
- Number of ads: 1 vs 2 vs 3 ad units
- Position: Above content vs below vs sidebar
- Size: Standard sizes vs responsive
- Type: Display vs native vs video
4. Page Design
- Background: Dark vs light theme
- Layout: Centered vs full-width
- Content: Minimal vs detailed file info
- Branding: Logo prominent vs subtle
Analyzing Results
Key Metrics to Compare
- Revenue per visitor: Total earnings divided by visitors
- Click-through rate: Percentage who click download
- Ad viewability: Percentage of ads actually seen
- Bounce rate: Percentage who leave before download
- Time on page: How long users stay
Statistical Significance
Don’t declare a winner too early. Wait until:
- Each variant has 1,000+ visitors
- Test has run for at least 7 days
- Confidence level reaches 95%+
Common A/B Testing Mistakes
1. Testing Too Many Things at Once
Change only ONE element per test. If you change button color AND timer length, you won’t know which caused the difference.
2. Ending Tests Too Early
Early results can be misleading. A variant might look like a winner on day 1 but lose by day 7. Wait for statistical significance.
3. Ignoring Mobile
Desktop and mobile users behave differently. Segment your results or run separate tests for each device type.
Real-World Test Results
Here are some common findings from A/B tests on safelink pages:
- Green buttons: Often outperform blue by 5-10%
- 8-second timers: Sweet spot for most sites
- Dark backgrounds: Higher ad visibility than light
- File details: Showing file name/size increases trust
Implementing Winners
Once you have a winner:
- Deploy the winning variant to 100% of traffic
- Document what you learned
- Plan your next test
- Monitor for any regression
Conclusion
A/B testing transforms guesswork into data-driven decisions. By systematically testing elements of your safelink pages, you can incrementally improve revenue without risking your entire traffic. Start with one test today – even a 5% improvement adds up over millions of visitors.
Ready to optimize your safelink pages? Get WP Safelink with built-in A/B testing capabilities.
Think your safelink pages are optimized? Without A/B testing, you’re just guessing. This guide shows you how to systematically test and improve your WP Safelink pages for maximum revenue.
What is A/B Testing?
A/B testing (split testing) compares two versions of a page to see which performs better. You show Version A to half your visitors and Version B to the other half, then measure which generates more revenue.
Why A/B Test Safelink Pages?
Small changes can have big impacts on revenue:
- Timer length: 5 seconds vs 10 seconds – which earns more?
- Button color: Green vs blue – which gets more clicks?
- Ad placement: Above countdown vs below – which has higher viewability?
- Page layout: Minimal vs detailed – which converts better?
Setting Up A/B Tests in WP Safelink
Step 1: Create Two Page Variants
In WP Safelink, create two versions of your redirect page with one key difference:
- Go to WP Safelink ??? Templates
- Duplicate your current template
- Modify ONE element (e.g., timer length)
- Save as “Template B”
Step 2: Configure Traffic Split
Set up how traffic is distributed between variants:
- 50/50 split: Standard for most tests
- 90/10 split: For risky changes you want to test safely
- Traffic minimum: Need at least 1,000 visitors per variant for statistical significance
Step 3: Track Results
Monitor these key metrics:
What to Test
1. Countdown Timer Length
Test these common timer lengths:
- Short (3-5 seconds): Higher completion rate, lower ad revenue
- Medium (6-10 seconds): Balanced approach
- Long (15-30 seconds): Higher ad revenue, higher bounce rate
2. Download Button
Test variations of:
- Color: Green, blue, orange, red
- Size: Small, medium, large
- Text: “Download”, “Get File”, “Download Now”, “Click Here”
- Position: Top, center, bottom of page
3. Ad Placement
Test different ad configurations:
- Number of ads: 1 vs 2 vs 3 ad units
- Position: Above content vs below vs sidebar
- Size: Standard sizes vs responsive
- Type: Display vs native vs video
4. Page Design
- Background: Dark vs light theme
- Layout: Centered vs full-width
- Content: Minimal vs detailed file info
- Branding: Logo prominent vs subtle
Analyzing Results
Key Metrics to Compare
- Revenue per visitor: Total earnings divided by visitors
- Click-through rate: Percentage who click download
- Ad viewability: Percentage of ads actually seen
- Bounce rate: Percentage who leave before download
- Time on page: How long users stay
Statistical Significance
Don’t declare a winner too early. Wait until:
- Each variant has 1,000+ visitors
- Test has run for at least 7 days
- Confidence level reaches 95%+
Common A/B Testing Mistakes
1. Testing Too Many Things at Once
Change only ONE element per test. If you change button color AND timer length, you won’t know which caused the difference.
2. Ending Tests Too Early
Early results can be misleading. A variant might look like a winner on day 1 but lose by day 7. Wait for statistical significance.
3. Ignoring Mobile
Desktop and mobile users behave differently. Segment your results or run separate tests for each device type.
Real-World Test Results
Here are some common findings from A/B tests on safelink pages:
- Green buttons: Often outperform blue by 5-10%
- 8-second timers: Sweet spot for most sites
- Dark backgrounds: Higher ad visibility than light
- File details: Showing file name/size increases trust
Implementing Winners
Once you have a winner:
- Deploy the winning variant to 100% of traffic
- Document what you learned
- Plan your next test
- Monitor for any regression
Conclusion
A/B testing transforms guesswork into data-driven decisions. By systematically testing elements of your safelink pages, you can incrementally improve revenue without risking your entire traffic. Start with one test today – even a 5% improvement adds up over millions of visitors.
Ready to optimize your safelink pages? Get WP Safelink with built-in A/B testing capabilities.
What to Test
1. Countdown Timer Length
Test these common timer lengths:
- Short (3-5 seconds): Higher completion rate, lower ad revenue
- Medium (6-10 seconds): Balanced approach
- Long (15-30 seconds): Higher ad revenue, higher bounce rate
2. Download Button
Test variations of:
- Color: Green, blue, orange, red
- Size: Small, medium, large
- Text: “Download”, “Get File”, “Download Now”, “Click Here”
- Position: Top, center, bottom of page
3. Ad Placement
Test different ad configurations:
- Number of ads: 1 vs 2 vs 3 ad units
- Position: Above content vs below vs sidebar
- Size: Standard sizes vs responsive
- Type: Display vs native vs video
4. Page Design
- Background: Dark vs light theme
- Layout: Centered vs full-width
- Content: Minimal vs detailed file info
- Branding: Logo prominent vs subtle
Analyzing Results
Key Metrics to Compare
- Revenue per visitor: Total earnings divided by visitors
- Click-through rate: Percentage who click download
- Ad viewability: Percentage of ads actually seen
- Bounce rate: Percentage who leave before download
- Time on page: How long users stay
Statistical Significance
Don’t declare a winner too early. Wait until:
- Each variant has 1,000+ visitors
- Test has run for at least 7 days
- Confidence level reaches 95%+
Common A/B Testing Mistakes
1. Testing Too Many Things at Once
Change only ONE element per test. If you change button color AND timer length, you won’t know which caused the difference.
2. Ending Tests Too Early
Early results can be misleading. A variant might look like a winner on day 1 but lose by day 7. Wait for statistical significance.
3. Ignoring Mobile
Desktop and mobile users behave differently. Segment your results or run separate tests for each device type.
Real-World Test Results
Here are some common findings from A/B tests on safelink pages:
- Green buttons: Often outperform blue by 5-10%
- 8-second timers: Sweet spot for most sites
- Dark backgrounds: Higher ad visibility than light
- File details: Showing file name/size increases trust
Implementing Winners
Once you have a winner:
- Deploy the winning variant to 100% of traffic
- Document what you learned
- Plan your next test
- Monitor for any regression
Conclusion
A/B testing transforms guesswork into data-driven decisions. By systematically testing elements of your safelink pages, you can incrementally improve revenue without risking your entire traffic. Start with one test today – even a 5% improvement adds up over millions of visitors.
Ready to optimize your safelink pages? Get WP Safelink with built-in A/B testing capabilities.
What is A/B Testing?
A/B testing (split testing) compares two versions of a page to see which performs better. You show Version A to half your visitors and Version B to the other half, then measure which generates more revenue.
Why A/B Test Safelink Pages?
Small changes can have big impacts on revenue:
- Timer length: 5 seconds vs 10 seconds – which earns more?
- Button color: Green vs blue – which gets more clicks?
- Ad placement: Above countdown vs below – which has higher viewability?
- Page layout: Minimal vs detailed – which converts better?
Setting Up A/B Tests in WP Safelink
Step 1: Create Two Page Variants
In WP Safelink, create two versions of your redirect page with one key difference:
- Go to WP Safelink ??? Templates
- Duplicate your current template
- Modify ONE element (e.g., timer length)
- Save as “Template B”
Step 2: Configure Traffic Split
Set up how traffic is distributed between variants:
- 50/50 split: Standard for most tests
- 90/10 split: For risky changes you want to test safely
- Traffic minimum: Need at least 1,000 visitors per variant for statistical significance
Step 3: Track Results
Monitor these key metrics:
What to Test
1. Countdown Timer Length
Test these common timer lengths:
- Short (3-5 seconds): Higher completion rate, lower ad revenue
- Medium (6-10 seconds): Balanced approach
- Long (15-30 seconds): Higher ad revenue, higher bounce rate
2. Download Button
Test variations of:
- Color: Green, blue, orange, red
- Size: Small, medium, large
- Text: “Download”, “Get File”, “Download Now”, “Click Here”
- Position: Top, center, bottom of page
3. Ad Placement
Test different ad configurations:
- Number of ads: 1 vs 2 vs 3 ad units
- Position: Above content vs below vs sidebar
- Size: Standard sizes vs responsive
- Type: Display vs native vs video
4. Page Design
- Background: Dark vs light theme
- Layout: Centered vs full-width
- Content: Minimal vs detailed file info
- Branding: Logo prominent vs subtle
Analyzing Results
Key Metrics to Compare
- Revenue per visitor: Total earnings divided by visitors
- Click-through rate: Percentage who click download
- Ad viewability: Percentage of ads actually seen
- Bounce rate: Percentage who leave before download
- Time on page: How long users stay
Statistical Significance
Don’t declare a winner too early. Wait until:
- Each variant has 1,000+ visitors
- Test has run for at least 7 days
- Confidence level reaches 95%+
Common A/B Testing Mistakes
1. Testing Too Many Things at Once
Change only ONE element per test. If you change button color AND timer length, you won’t know which caused the difference.
2. Ending Tests Too Early
Early results can be misleading. A variant might look like a winner on day 1 but lose by day 7. Wait for statistical significance.
3. Ignoring Mobile
Desktop and mobile users behave differently. Segment your results or run separate tests for each device type.
Real-World Test Results
Here are some common findings from A/B tests on safelink pages:
- Green buttons: Often outperform blue by 5-10%
- 8-second timers: Sweet spot for most sites
- Dark backgrounds: Higher ad visibility than light
- File details: Showing file name/size increases trust
Implementing Winners
Once you have a winner:
- Deploy the winning variant to 100% of traffic
- Document what you learned
- Plan your next test
- Monitor for any regression
Conclusion
A/B testing transforms guesswork into data-driven decisions. By systematically testing elements of your safelink pages, you can incrementally improve revenue without risking your entire traffic. Start with one test today – even a 5% improvement adds up over millions of visitors.
Ready to optimize your safelink pages? Get WP Safelink with built-in A/B testing capabilities.
Think your safelink pages are optimized? Without A/B testing, you’re just guessing. This guide shows you how to systematically test and improve your WP Safelink pages for maximum revenue.
What is A/B Testing?
A/B testing (split testing) compares two versions of a page to see which performs better. You show Version A to half your visitors and Version B to the other half, then measure which generates more revenue.
Why A/B Test Safelink Pages?
Small changes can have big impacts on revenue:
- Timer length: 5 seconds vs 10 seconds – which earns more?
- Button color: Green vs blue – which gets more clicks?
- Ad placement: Above countdown vs below – which has higher viewability?
- Page layout: Minimal vs detailed – which converts better?
Setting Up A/B Tests in WP Safelink
Step 1: Create Two Page Variants
In WP Safelink, create two versions of your redirect page with one key difference:
- Go to WP Safelink ??? Templates
- Duplicate your current template
- Modify ONE element (e.g., timer length)
- Save as “Template B”
Step 2: Configure Traffic Split
Set up how traffic is distributed between variants:
- 50/50 split: Standard for most tests
- 90/10 split: For risky changes you want to test safely
- Traffic minimum: Need at least 1,000 visitors per variant for statistical significance
Step 3: Track Results
Monitor these key metrics:
What to Test
1. Countdown Timer Length
Test these common timer lengths:
- Short (3-5 seconds): Higher completion rate, lower ad revenue
- Medium (6-10 seconds): Balanced approach
- Long (15-30 seconds): Higher ad revenue, higher bounce rate
2. Download Button
Test variations of:
- Color: Green, blue, orange, red
- Size: Small, medium, large
- Text: “Download”, “Get File”, “Download Now”, “Click Here”
- Position: Top, center, bottom of page
3. Ad Placement
Test different ad configurations:
- Number of ads: 1 vs 2 vs 3 ad units
- Position: Above content vs below vs sidebar
- Size: Standard sizes vs responsive
- Type: Display vs native vs video
4. Page Design
- Background: Dark vs light theme
- Layout: Centered vs full-width
- Content: Minimal vs detailed file info
- Branding: Logo prominent vs subtle
Analyzing Results
Key Metrics to Compare
- Revenue per visitor: Total earnings divided by visitors
- Click-through rate: Percentage who click download
- Ad viewability: Percentage of ads actually seen
- Bounce rate: Percentage who leave before download
- Time on page: How long users stay
Statistical Significance
Don’t declare a winner too early. Wait until:
- Each variant has 1,000+ visitors
- Test has run for at least 7 days
- Confidence level reaches 95%+
Common A/B Testing Mistakes
1. Testing Too Many Things at Once
Change only ONE element per test. If you change button color AND timer length, you won’t know which caused the difference.
2. Ending Tests Too Early
Early results can be misleading. A variant might look like a winner on day 1 but lose by day 7. Wait for statistical significance.
3. Ignoring Mobile
Desktop and mobile users behave differently. Segment your results or run separate tests for each device type.
Real-World Test Results
Here are some common findings from A/B tests on safelink pages:
- Green buttons: Often outperform blue by 5-10%
- 8-second timers: Sweet spot for most sites
- Dark backgrounds: Higher ad visibility than light
- File details: Showing file name/size increases trust
Implementing Winners
Once you have a winner:
- Deploy the winning variant to 100% of traffic
- Document what you learned
- Plan your next test
- Monitor for any regression
Conclusion
A/B testing transforms guesswork into data-driven decisions. By systematically testing elements of your safelink pages, you can incrementally improve revenue without risking your entire traffic. Start with one test today – even a 5% improvement adds up over millions of visitors.
Ready to optimize your safelink pages? Get WP Safelink with built-in A/B testing capabilities.
What is A/B Testing?
A/B testing (split testing) compares two versions of a page to see which performs better. You show Version A to half your visitors and Version B to the other half, then measure which generates more revenue.
Why A/B Test Safelink Pages?
Small changes can have big impacts on revenue:
- Timer length: 5 seconds vs 10 seconds – which earns more?
- Button color: Green vs blue – which gets more clicks?
- Ad placement: Above countdown vs below – which has higher viewability?
- Page layout: Minimal vs detailed – which converts better?
Setting Up A/B Tests in WP Safelink
Step 1: Create Two Page Variants
In WP Safelink, create two versions of your redirect page with one key difference:
- Go to WP Safelink ??? Templates
- Duplicate your current template
- Modify ONE element (e.g., timer length)
- Save as “Template B”
Step 2: Configure Traffic Split
Set up how traffic is distributed between variants:
- 50/50 split: Standard for most tests
- 90/10 split: For risky changes you want to test safely
- Traffic minimum: Need at least 1,000 visitors per variant for statistical significance
Step 3: Track Results
Monitor these key metrics:
What to Test
1. Countdown Timer Length
Test these common timer lengths:
- Short (3-5 seconds): Higher completion rate, lower ad revenue
- Medium (6-10 seconds): Balanced approach
- Long (15-30 seconds): Higher ad revenue, higher bounce rate
2. Download Button
Test variations of:
- Color: Green, blue, orange, red
- Size: Small, medium, large
- Text: “Download”, “Get File”, “Download Now”, “Click Here”
- Position: Top, center, bottom of page
3. Ad Placement
Test different ad configurations:
- Number of ads: 1 vs 2 vs 3 ad units
- Position: Above content vs below vs sidebar
- Size: Standard sizes vs responsive
- Type: Display vs native vs video
4. Page Design
- Background: Dark vs light theme
- Layout: Centered vs full-width
- Content: Minimal vs detailed file info
- Branding: Logo prominent vs subtle
Analyzing Results
Key Metrics to Compare
- Revenue per visitor: Total earnings divided by visitors
- Click-through rate: Percentage who click download
- Ad viewability: Percentage of ads actually seen
- Bounce rate: Percentage who leave before download
- Time on page: How long users stay
Statistical Significance
Don’t declare a winner too early. Wait until:
- Each variant has 1,000+ visitors
- Test has run for at least 7 days
- Confidence level reaches 95%+
Common A/B Testing Mistakes
1. Testing Too Many Things at Once
Change only ONE element per test. If you change button color AND timer length, you won’t know which caused the difference.
2. Ending Tests Too Early
Early results can be misleading. A variant might look like a winner on day 1 but lose by day 7. Wait for statistical significance.
3. Ignoring Mobile
Desktop and mobile users behave differently. Segment your results or run separate tests for each device type.
Real-World Test Results
Here are some common findings from A/B tests on safelink pages:
- Green buttons: Often outperform blue by 5-10%
- 8-second timers: Sweet spot for most sites
- Dark backgrounds: Higher ad visibility than light
- File details: Showing file name/size increases trust
Implementing Winners
Once you have a winner:
- Deploy the winning variant to 100% of traffic
- Document what you learned
- Plan your next test
- Monitor for any regression
Conclusion
A/B testing transforms guesswork into data-driven decisions. By systematically testing elements of your safelink pages, you can incrementally improve revenue without risking your entire traffic. Start with one test today – even a 5% improvement adds up over millions of visitors.
Ready to optimize your safelink pages? Get WP Safelink with built-in A/B testing capabilities.
Think your safelink pages are optimized? Without A/B testing, you’re just guessing. This guide shows you how to systematically test and improve your WP Safelink pages for maximum revenue.
What is A/B Testing?
A/B testing (split testing) compares two versions of a page to see which performs better. You show Version A to half your visitors and Version B to the other half, then measure which generates more revenue.
Why A/B Test Safelink Pages?
Small changes can have big impacts on revenue:
- Timer length: 5 seconds vs 10 seconds – which earns more?
- Button color: Green vs blue – which gets more clicks?
- Ad placement: Above countdown vs below – which has higher viewability?
- Page layout: Minimal vs detailed – which converts better?
Setting Up A/B Tests in WP Safelink
Step 1: Create Two Page Variants
In WP Safelink, create two versions of your redirect page with one key difference:
- Go to WP Safelink ??? Templates
- Duplicate your current template
- Modify ONE element (e.g., timer length)
- Save as “Template B”
Step 2: Configure Traffic Split
Set up how traffic is distributed between variants:
- 50/50 split: Standard for most tests
- 90/10 split: For risky changes you want to test safely
- Traffic minimum: Need at least 1,000 visitors per variant for statistical significance
Step 3: Track Results
Monitor these key metrics:
What to Test
1. Countdown Timer Length
Test these common timer lengths:
- Short (3-5 seconds): Higher completion rate, lower ad revenue
- Medium (6-10 seconds): Balanced approach
- Long (15-30 seconds): Higher ad revenue, higher bounce rate
2. Download Button
Test variations of:
- Color: Green, blue, orange, red
- Size: Small, medium, large
- Text: “Download”, “Get File”, “Download Now”, “Click Here”
- Position: Top, center, bottom of page
3. Ad Placement
Test different ad configurations:
- Number of ads: 1 vs 2 vs 3 ad units
- Position: Above content vs below vs sidebar
- Size: Standard sizes vs responsive
- Type: Display vs native vs video
4. Page Design
- Background: Dark vs light theme
- Layout: Centered vs full-width
- Content: Minimal vs detailed file info
- Branding: Logo prominent vs subtle
Analyzing Results
Key Metrics to Compare
- Revenue per visitor: Total earnings divided by visitors
- Click-through rate: Percentage who click download
- Ad viewability: Percentage of ads actually seen
- Bounce rate: Percentage who leave before download
- Time on page: How long users stay
Statistical Significance
Don’t declare a winner too early. Wait until:
- Each variant has 1,000+ visitors
- Test has run for at least 7 days
- Confidence level reaches 95%+
Common A/B Testing Mistakes
1. Testing Too Many Things at Once
Change only ONE element per test. If you change button color AND timer length, you won’t know which caused the difference.
2. Ending Tests Too Early
Early results can be misleading. A variant might look like a winner on day 1 but lose by day 7. Wait for statistical significance.
3. Ignoring Mobile
Desktop and mobile users behave differently. Segment your results or run separate tests for each device type.
Real-World Test Results
Here are some common findings from A/B tests on safelink pages:
- Green buttons: Often outperform blue by 5-10%
- 8-second timers: Sweet spot for most sites
- Dark backgrounds: Higher ad visibility than light
- File details: Showing file name/size increases trust
Implementing Winners
Once you have a winner:
- Deploy the winning variant to 100% of traffic
- Document what you learned
- Plan your next test
- Monitor for any regression
Conclusion
A/B testing transforms guesswork into data-driven decisions. By systematically testing elements of your safelink pages, you can incrementally improve revenue without risking your entire traffic. Start with one test today – even a 5% improvement adds up over millions of visitors.
Ready to optimize your safelink pages? Get WP Safelink with built-in A/B testing capabilities.
What to Test
1. Countdown Timer Length
Test these common timer lengths:
- Short (3-5 seconds): Higher completion rate, lower ad revenue
- Medium (6-10 seconds): Balanced approach
- Long (15-30 seconds): Higher ad revenue, higher bounce rate
2. Download Button
Test variations of:
- Color: Green, blue, orange, red
- Size: Small, medium, large
- Text: “Download”, “Get File”, “Download Now”, “Click Here”
- Position: Top, center, bottom of page
3. Ad Placement
Test different ad configurations:
- Number of ads: 1 vs 2 vs 3 ad units
- Position: Above content vs below vs sidebar
- Size: Standard sizes vs responsive
- Type: Display vs native vs video
4. Page Design
- Background: Dark vs light theme
- Layout: Centered vs full-width
- Content: Minimal vs detailed file info
- Branding: Logo prominent vs subtle
Analyzing Results
Key Metrics to Compare
- Revenue per visitor: Total earnings divided by visitors
- Click-through rate: Percentage who click download
- Ad viewability: Percentage of ads actually seen
- Bounce rate: Percentage who leave before download
- Time on page: How long users stay
Statistical Significance
Don’t declare a winner too early. Wait until:
- Each variant has 1,000+ visitors
- Test has run for at least 7 days
- Confidence level reaches 95%+
Common A/B Testing Mistakes
1. Testing Too Many Things at Once
Change only ONE element per test. If you change button color AND timer length, you won’t know which caused the difference.
2. Ending Tests Too Early
Early results can be misleading. A variant might look like a winner on day 1 but lose by day 7. Wait for statistical significance.
3. Ignoring Mobile
Desktop and mobile users behave differently. Segment your results or run separate tests for each device type.
Real-World Test Results
Here are some common findings from A/B tests on safelink pages:
- Green buttons: Often outperform blue by 5-10%
- 8-second timers: Sweet spot for most sites
- Dark backgrounds: Higher ad visibility than light
- File details: Showing file name/size increases trust
Implementing Winners
Once you have a winner:
- Deploy the winning variant to 100% of traffic
- Document what you learned
- Plan your next test
- Monitor for any regression
Conclusion
A/B testing transforms guesswork into data-driven decisions. By systematically testing elements of your safelink pages, you can incrementally improve revenue without risking your entire traffic. Start with one test today – even a 5% improvement adds up over millions of visitors.
Ready to optimize your safelink pages? Get WP Safelink with built-in A/B testing capabilities.
What is A/B Testing?
A/B testing (split testing) compares two versions of a page to see which performs better. You show Version A to half your visitors and Version B to the other half, then measure which generates more revenue.
Why A/B Test Safelink Pages?
Small changes can have big impacts on revenue:
- Timer length: 5 seconds vs 10 seconds – which earns more?
- Button color: Green vs blue – which gets more clicks?
- Ad placement: Above countdown vs below – which has higher viewability?
- Page layout: Minimal vs detailed – which converts better?
Setting Up A/B Tests in WP Safelink
Step 1: Create Two Page Variants
In WP Safelink, create two versions of your redirect page with one key difference:
- Go to WP Safelink ??? Templates
- Duplicate your current template
- Modify ONE element (e.g., timer length)
- Save as “Template B”
Step 2: Configure Traffic Split
Set up how traffic is distributed between variants:
- 50/50 split: Standard for most tests
- 90/10 split: For risky changes you want to test safely
- Traffic minimum: Need at least 1,000 visitors per variant for statistical significance
Step 3: Track Results
Monitor these key metrics:
What to Test
1. Countdown Timer Length
Test these common timer lengths:
- Short (3-5 seconds): Higher completion rate, lower ad revenue
- Medium (6-10 seconds): Balanced approach
- Long (15-30 seconds): Higher ad revenue, higher bounce rate
2. Download Button
Test variations of:
- Color: Green, blue, orange, red
- Size: Small, medium, large
- Text: “Download”, “Get File”, “Download Now”, “Click Here”
- Position: Top, center, bottom of page
3. Ad Placement
Test different ad configurations:
- Number of ads: 1 vs 2 vs 3 ad units
- Position: Above content vs below vs sidebar
- Size: Standard sizes vs responsive
- Type: Display vs native vs video
4. Page Design
- Background: Dark vs light theme
- Layout: Centered vs full-width
- Content: Minimal vs detailed file info
- Branding: Logo prominent vs subtle
Analyzing Results
Key Metrics to Compare
- Revenue per visitor: Total earnings divided by visitors
- Click-through rate: Percentage who click download
- Ad viewability: Percentage of ads actually seen
- Bounce rate: Percentage who leave before download
- Time on page: How long users stay
Statistical Significance
Don’t declare a winner too early. Wait until:
- Each variant has 1,000+ visitors
- Test has run for at least 7 days
- Confidence level reaches 95%+
Common A/B Testing Mistakes
1. Testing Too Many Things at Once
Change only ONE element per test. If you change button color AND timer length, you won’t know which caused the difference.
2. Ending Tests Too Early
Early results can be misleading. A variant might look like a winner on day 1 but lose by day 7. Wait for statistical significance.
3. Ignoring Mobile
Desktop and mobile users behave differently. Segment your results or run separate tests for each device type.
Real-World Test Results
Here are some common findings from A/B tests on safelink pages:
- Green buttons: Often outperform blue by 5-10%
- 8-second timers: Sweet spot for most sites
- Dark backgrounds: Higher ad visibility than light
- File details: Showing file name/size increases trust
Implementing Winners
Once you have a winner:
- Deploy the winning variant to 100% of traffic
- Document what you learned
- Plan your next test
- Monitor for any regression
Conclusion
A/B testing transforms guesswork into data-driven decisions. By systematically testing elements of your safelink pages, you can incrementally improve revenue without risking your entire traffic. Start with one test today – even a 5% improvement adds up over millions of visitors.
Ready to optimize your safelink pages? Get WP Safelink with built-in A/B testing capabilities.
Think your safelink pages are optimized? Without A/B testing, you’re just guessing. This guide shows you how to systematically test and improve your WP Safelink pages for maximum revenue.
What is A/B Testing?
A/B testing (split testing) compares two versions of a page to see which performs better. You show Version A to half your visitors and Version B to the other half, then measure which generates more revenue.
Why A/B Test Safelink Pages?
Small changes can have big impacts on revenue:
- Timer length: 5 seconds vs 10 seconds – which earns more?
- Button color: Green vs blue – which gets more clicks?
- Ad placement: Above countdown vs below – which has higher viewability?
- Page layout: Minimal vs detailed – which converts better?
Setting Up A/B Tests in WP Safelink
Step 1: Create Two Page Variants
In WP Safelink, create two versions of your redirect page with one key difference:
- Go to WP Safelink ??? Templates
- Duplicate your current template
- Modify ONE element (e.g., timer length)
- Save as “Template B”
Step 2: Configure Traffic Split
Set up how traffic is distributed between variants:
- 50/50 split: Standard for most tests
- 90/10 split: For risky changes you want to test safely
- Traffic minimum: Need at least 1,000 visitors per variant for statistical significance
Step 3: Track Results
Monitor these key metrics:
What to Test
1. Countdown Timer Length
Test these common timer lengths:
- Short (3-5 seconds): Higher completion rate, lower ad revenue
- Medium (6-10 seconds): Balanced approach
- Long (15-30 seconds): Higher ad revenue, higher bounce rate
2. Download Button
Test variations of:
- Color: Green, blue, orange, red
- Size: Small, medium, large
- Text: “Download”, “Get File”, “Download Now”, “Click Here”
- Position: Top, center, bottom of page
3. Ad Placement
Test different ad configurations:
- Number of ads: 1 vs 2 vs 3 ad units
- Position: Above content vs below vs sidebar
- Size: Standard sizes vs responsive
- Type: Display vs native vs video
4. Page Design
- Background: Dark vs light theme
- Layout: Centered vs full-width
- Content: Minimal vs detailed file info
- Branding: Logo prominent vs subtle
Analyzing Results
Key Metrics to Compare
- Revenue per visitor: Total earnings divided by visitors
- Click-through rate: Percentage who click download
- Ad viewability: Percentage of ads actually seen
- Bounce rate: Percentage who leave before download
- Time on page: How long users stay
Statistical Significance
Don’t declare a winner too early. Wait until:
- Each variant has 1,000+ visitors
- Test has run for at least 7 days
- Confidence level reaches 95%+
Common A/B Testing Mistakes
1. Testing Too Many Things at Once
Change only ONE element per test. If you change button color AND timer length, you won’t know which caused the difference.
2. Ending Tests Too Early
Early results can be misleading. A variant might look like a winner on day 1 but lose by day 7. Wait for statistical significance.
3. Ignoring Mobile
Desktop and mobile users behave differently. Segment your results or run separate tests for each device type.
Real-World Test Results
Here are some common findings from A/B tests on safelink pages:
- Green buttons: Often outperform blue by 5-10%
- 8-second timers: Sweet spot for most sites
- Dark backgrounds: Higher ad visibility than light
- File details: Showing file name/size increases trust
Implementing Winners
Once you have a winner:
- Deploy the winning variant to 100% of traffic
- Document what you learned
- Plan your next test
- Monitor for any regression
Conclusion
A/B testing transforms guesswork into data-driven decisions. By systematically testing elements of your safelink pages, you can incrementally improve revenue without risking your entire traffic. Start with one test today – even a 5% improvement adds up over millions of visitors.
Ready to optimize your safelink pages? Get WP Safelink with built-in A/B testing capabilities.
What to Test
1. Countdown Timer Length
Test these common timer lengths:
- Short (3-5 seconds): Higher completion rate, lower ad revenue
- Medium (6-10 seconds): Balanced approach
- Long (15-30 seconds): Higher ad revenue, higher bounce rate
2. Download Button
Test variations of:
- Color: Green, blue, orange, red
- Size: Small, medium, large
- Text: “Download”, “Get File”, “Download Now”, “Click Here”
- Position: Top, center, bottom of page
3. Ad Placement
Test different ad configurations:
- Number of ads: 1 vs 2 vs 3 ad units
- Position: Above content vs below vs sidebar
- Size: Standard sizes vs responsive
- Type: Display vs native vs video
4. Page Design
- Background: Dark vs light theme
- Layout: Centered vs full-width
- Content: Minimal vs detailed file info
- Branding: Logo prominent vs subtle
Analyzing Results
Key Metrics to Compare
- Revenue per visitor: Total earnings divided by visitors
- Click-through rate: Percentage who click download
- Ad viewability: Percentage of ads actually seen
- Bounce rate: Percentage who leave before download
- Time on page: How long users stay
Statistical Significance
Don’t declare a winner too early. Wait until:
- Each variant has 1,000+ visitors
- Test has run for at least 7 days
- Confidence level reaches 95%+
Common A/B Testing Mistakes
1. Testing Too Many Things at Once
Change only ONE element per test. If you change button color AND timer length, you won’t know which caused the difference.
2. Ending Tests Too Early
Early results can be misleading. A variant might look like a winner on day 1 but lose by day 7. Wait for statistical significance.
3. Ignoring Mobile
Desktop and mobile users behave differently. Segment your results or run separate tests for each device type.
Real-World Test Results
Here are some common findings from A/B tests on safelink pages:
- Green buttons: Often outperform blue by 5-10%
- 8-second timers: Sweet spot for most sites
- Dark backgrounds: Higher ad visibility than light
- File details: Showing file name/size increases trust
Implementing Winners
Once you have a winner:
- Deploy the winning variant to 100% of traffic
- Document what you learned
- Plan your next test
- Monitor for any regression
Conclusion
A/B testing transforms guesswork into data-driven decisions. By systematically testing elements of your safelink pages, you can incrementally improve revenue without risking your entire traffic. Start with one test today – even a 5% improvement adds up over millions of visitors.
Ready to optimize your safelink pages? Get WP Safelink with built-in A/B testing capabilities.
What is A/B Testing?
A/B testing (split testing) compares two versions of a page to see which performs better. You show Version A to half your visitors and Version B to the other half, then measure which generates more revenue.
Why A/B Test Safelink Pages?
Small changes can have big impacts on revenue:
- Timer length: 5 seconds vs 10 seconds – which earns more?
- Button color: Green vs blue – which gets more clicks?
- Ad placement: Above countdown vs below – which has higher viewability?
- Page layout: Minimal vs detailed – which converts better?
Setting Up A/B Tests in WP Safelink
Step 1: Create Two Page Variants
In WP Safelink, create two versions of your redirect page with one key difference:
- Go to WP Safelink ??? Templates
- Duplicate your current template
- Modify ONE element (e.g., timer length)
- Save as “Template B”
Step 2: Configure Traffic Split
Set up how traffic is distributed between variants:
- 50/50 split: Standard for most tests
- 90/10 split: For risky changes you want to test safely
- Traffic minimum: Need at least 1,000 visitors per variant for statistical significance
Step 3: Track Results
Monitor these key metrics:
What to Test
1. Countdown Timer Length
Test these common timer lengths:
- Short (3-5 seconds): Higher completion rate, lower ad revenue
- Medium (6-10 seconds): Balanced approach
- Long (15-30 seconds): Higher ad revenue, higher bounce rate
2. Download Button
Test variations of:
- Color: Green, blue, orange, red
- Size: Small, medium, large
- Text: “Download”, “Get File”, “Download Now”, “Click Here”
- Position: Top, center, bottom of page
3. Ad Placement
Test different ad configurations:
- Number of ads: 1 vs 2 vs 3 ad units
- Position: Above content vs below vs sidebar
- Size: Standard sizes vs responsive
- Type: Display vs native vs video
4. Page Design
- Background: Dark vs light theme
- Layout: Centered vs full-width
- Content: Minimal vs detailed file info
- Branding: Logo prominent vs subtle
Analyzing Results
Key Metrics to Compare
- Revenue per visitor: Total earnings divided by visitors
- Click-through rate: Percentage who click download
- Ad viewability: Percentage of ads actually seen
- Bounce rate: Percentage who leave before download
- Time on page: How long users stay
Statistical Significance
Don’t declare a winner too early. Wait until:
- Each variant has 1,000+ visitors
- Test has run for at least 7 days
- Confidence level reaches 95%+
Common A/B Testing Mistakes
1. Testing Too Many Things at Once
Change only ONE element per test. If you change button color AND timer length, you won’t know which caused the difference.
2. Ending Tests Too Early
Early results can be misleading. A variant might look like a winner on day 1 but lose by day 7. Wait for statistical significance.
3. Ignoring Mobile
Desktop and mobile users behave differently. Segment your results or run separate tests for each device type.
Real-World Test Results
Here are some common findings from A/B tests on safelink pages:
- Green buttons: Often outperform blue by 5-10%
- 8-second timers: Sweet spot for most sites
- Dark backgrounds: Higher ad visibility than light
- File details: Showing file name/size increases trust
Implementing Winners
Once you have a winner:
- Deploy the winning variant to 100% of traffic
- Document what you learned
- Plan your next test
- Monitor for any regression
Conclusion
A/B testing transforms guesswork into data-driven decisions. By systematically testing elements of your safelink pages, you can incrementally improve revenue without risking your entire traffic. Start with one test today – even a 5% improvement adds up over millions of visitors.
Ready to optimize your safelink pages? Get WP Safelink with built-in A/B testing capabilities.
Think your safelink pages are optimized? Without A/B testing, you’re just guessing. This guide shows you how to systematically test and improve your WP Safelink pages for maximum revenue.
What is A/B Testing?
A/B testing (split testing) compares two versions of a page to see which performs better. You show Version A to half your visitors and Version B to the other half, then measure which generates more revenue.
Why A/B Test Safelink Pages?
Small changes can have big impacts on revenue:
- Timer length: 5 seconds vs 10 seconds – which earns more?
- Button color: Green vs blue – which gets more clicks?
- Ad placement: Above countdown vs below – which has higher viewability?
- Page layout: Minimal vs detailed – which converts better?
Setting Up A/B Tests in WP Safelink
Step 1: Create Two Page Variants
In WP Safelink, create two versions of your redirect page with one key difference:
- Go to WP Safelink ??? Templates
- Duplicate your current template
- Modify ONE element (e.g., timer length)
- Save as “Template B”
Step 2: Configure Traffic Split
Set up how traffic is distributed between variants:
- 50/50 split: Standard for most tests
- 90/10 split: For risky changes you want to test safely
- Traffic minimum: Need at least 1,000 visitors per variant for statistical significance
Step 3: Track Results
Monitor these key metrics:
What to Test
1. Countdown Timer Length
Test these common timer lengths:
- Short (3-5 seconds): Higher completion rate, lower ad revenue
- Medium (6-10 seconds): Balanced approach
- Long (15-30 seconds): Higher ad revenue, higher bounce rate
2. Download Button
Test variations of:
- Color: Green, blue, orange, red
- Size: Small, medium, large
- Text: “Download”, “Get File”, “Download Now”, “Click Here”
- Position: Top, center, bottom of page
3. Ad Placement
Test different ad configurations:
- Number of ads: 1 vs 2 vs 3 ad units
- Position: Above content vs below vs sidebar
- Size: Standard sizes vs responsive
- Type: Display vs native vs video
4. Page Design
- Background: Dark vs light theme
- Layout: Centered vs full-width
- Content: Minimal vs detailed file info
- Branding: Logo prominent vs subtle
Analyzing Results
Key Metrics to Compare
- Revenue per visitor: Total earnings divided by visitors
- Click-through rate: Percentage who click download
- Ad viewability: Percentage of ads actually seen
- Bounce rate: Percentage who leave before download
- Time on page: How long users stay
Statistical Significance
Don’t declare a winner too early. Wait until:
- Each variant has 1,000+ visitors
- Test has run for at least 7 days
- Confidence level reaches 95%+
Common A/B Testing Mistakes
1. Testing Too Many Things at Once
Change only ONE element per test. If you change button color AND timer length, you won’t know which caused the difference.
2. Ending Tests Too Early
Early results can be misleading. A variant might look like a winner on day 1 but lose by day 7. Wait for statistical significance.
3. Ignoring Mobile
Desktop and mobile users behave differently. Segment your results or run separate tests for each device type.
Real-World Test Results
Here are some common findings from A/B tests on safelink pages:
- Green buttons: Often outperform blue by 5-10%
- 8-second timers: Sweet spot for most sites
- Dark backgrounds: Higher ad visibility than light
- File details: Showing file name/size increases trust
Implementing Winners
Once you have a winner:
- Deploy the winning variant to 100% of traffic
- Document what you learned
- Plan your next test
- Monitor for any regression
Conclusion
A/B testing transforms guesswork into data-driven decisions. By systematically testing elements of your safelink pages, you can incrementally improve revenue without risking your entire traffic. Start with one test today – even a 5% improvement adds up over millions of visitors.
Ready to optimize your safelink pages? Get WP Safelink with built-in A/B testing capabilities.
What to Test
1. Countdown Timer Length
Test these common timer lengths:
- Short (3-5 seconds): Higher completion rate, lower ad revenue
- Medium (6-10 seconds): Balanced approach
- Long (15-30 seconds): Higher ad revenue, higher bounce rate
2. Download Button
Test variations of:
- Color: Green, blue, orange, red
- Size: Small, medium, large
- Text: “Download”, “Get File”, “Download Now”, “Click Here”
- Position: Top, center, bottom of page
3. Ad Placement
Test different ad configurations:
- Number of ads: 1 vs 2 vs 3 ad units
- Position: Above content vs below vs sidebar
- Size: Standard sizes vs responsive
- Type: Display vs native vs video
4. Page Design
- Background: Dark vs light theme
- Layout: Centered vs full-width
- Content: Minimal vs detailed file info
- Branding: Logo prominent vs subtle
Analyzing Results
Key Metrics to Compare
- Revenue per visitor: Total earnings divided by visitors
- Click-through rate: Percentage who click download
- Ad viewability: Percentage of ads actually seen
- Bounce rate: Percentage who leave before download
- Time on page: How long users stay
Statistical Significance
Don’t declare a winner too early. Wait until:
- Each variant has 1,000+ visitors
- Test has run for at least 7 days
- Confidence level reaches 95%+
Common A/B Testing Mistakes
1. Testing Too Many Things at Once
Change only ONE element per test. If you change button color AND timer length, you won’t know which caused the difference.
2. Ending Tests Too Early
Early results can be misleading. A variant might look like a winner on day 1 but lose by day 7. Wait for statistical significance.
3. Ignoring Mobile
Desktop and mobile users behave differently. Segment your results or run separate tests for each device type.
Real-World Test Results
Here are some common findings from A/B tests on safelink pages:
- Green buttons: Often outperform blue by 5-10%
- 8-second timers: Sweet spot for most sites
- Dark backgrounds: Higher ad visibility than light
- File details: Showing file name/size increases trust
Implementing Winners
Once you have a winner:
- Deploy the winning variant to 100% of traffic
- Document what you learned
- Plan your next test
- Monitor for any regression
Conclusion
A/B testing transforms guesswork into data-driven decisions. By systematically testing elements of your safelink pages, you can incrementally improve revenue without risking your entire traffic. Start with one test today – even a 5% improvement adds up over millions of visitors.
Ready to optimize your safelink pages? Get WP Safelink with built-in A/B testing capabilities.
What is A/B Testing?
A/B testing (split testing) compares two versions of a page to see which performs better. You show Version A to half your visitors and Version B to the other half, then measure which generates more revenue.
Why A/B Test Safelink Pages?
Small changes can have big impacts on revenue:
- Timer length: 5 seconds vs 10 seconds – which earns more?
- Button color: Green vs blue – which gets more clicks?
- Ad placement: Above countdown vs below – which has higher viewability?
- Page layout: Minimal vs detailed – which converts better?
Setting Up A/B Tests in WP Safelink
Step 1: Create Two Page Variants
In WP Safelink, create two versions of your redirect page with one key difference:
- Go to WP Safelink ??? Templates
- Duplicate your current template
- Modify ONE element (e.g., timer length)
- Save as “Template B”
Step 2: Configure Traffic Split
Set up how traffic is distributed between variants:
- 50/50 split: Standard for most tests
- 90/10 split: For risky changes you want to test safely
- Traffic minimum: Need at least 1,000 visitors per variant for statistical significance
Step 3: Track Results
Monitor these key metrics:
What to Test
1. Countdown Timer Length
Test these common timer lengths:
- Short (3-5 seconds): Higher completion rate, lower ad revenue
- Medium (6-10 seconds): Balanced approach
- Long (15-30 seconds): Higher ad revenue, higher bounce rate
2. Download Button
Test variations of:
- Color: Green, blue, orange, red
- Size: Small, medium, large
- Text: “Download”, “Get File”, “Download Now”, “Click Here”
- Position: Top, center, bottom of page
3. Ad Placement
Test different ad configurations:
- Number of ads: 1 vs 2 vs 3 ad units
- Position: Above content vs below vs sidebar
- Size: Standard sizes vs responsive
- Type: Display vs native vs video
4. Page Design
- Background: Dark vs light theme
- Layout: Centered vs full-width
- Content: Minimal vs detailed file info
- Branding: Logo prominent vs subtle
Analyzing Results
Key Metrics to Compare
- Revenue per visitor: Total earnings divided by visitors
- Click-through rate: Percentage who click download
- Ad viewability: Percentage of ads actually seen
- Bounce rate: Percentage who leave before download
- Time on page: How long users stay
Statistical Significance
Don’t declare a winner too early. Wait until:
- Each variant has 1,000+ visitors
- Test has run for at least 7 days
- Confidence level reaches 95%+
Common A/B Testing Mistakes
1. Testing Too Many Things at Once
Change only ONE element per test. If you change button color AND timer length, you won’t know which caused the difference.
2. Ending Tests Too Early
Early results can be misleading. A variant might look like a winner on day 1 but lose by day 7. Wait for statistical significance.
3. Ignoring Mobile
Desktop and mobile users behave differently. Segment your results or run separate tests for each device type.
Real-World Test Results
Here are some common findings from A/B tests on safelink pages:
- Green buttons: Often outperform blue by 5-10%
- 8-second timers: Sweet spot for most sites
- Dark backgrounds: Higher ad visibility than light
- File details: Showing file name/size increases trust
Implementing Winners
Once you have a winner:
- Deploy the winning variant to 100% of traffic
- Document what you learned
- Plan your next test
- Monitor for any regression
Conclusion
A/B testing transforms guesswork into data-driven decisions. By systematically testing elements of your safelink pages, you can incrementally improve revenue without risking your entire traffic. Start with one test today – even a 5% improvement adds up over millions of visitors.
Ready to optimize your safelink pages? Get WP Safelink with built-in A/B testing capabilities.
Think your safelink pages are optimized? Without A/B testing, you’re just guessing. This guide shows you how to systematically test and improve your WP Safelink pages for maximum revenue.
What is A/B Testing?
A/B testing (split testing) compares two versions of a page to see which performs better. You show Version A to half your visitors and Version B to the other half, then measure which generates more revenue.
Why A/B Test Safelink Pages?
Small changes can have big impacts on revenue:
- Timer length: 5 seconds vs 10 seconds – which earns more?
- Button color: Green vs blue – which gets more clicks?
- Ad placement: Above countdown vs below – which has higher viewability?
- Page layout: Minimal vs detailed – which converts better?
Setting Up A/B Tests in WP Safelink
Step 1: Create Two Page Variants
In WP Safelink, create two versions of your redirect page with one key difference:
- Go to WP Safelink ??? Templates
- Duplicate your current template
- Modify ONE element (e.g., timer length)
- Save as “Template B”
Step 2: Configure Traffic Split
Set up how traffic is distributed between variants:
- 50/50 split: Standard for most tests
- 90/10 split: For risky changes you want to test safely
- Traffic minimum: Need at least 1,000 visitors per variant for statistical significance
Step 3: Track Results
Monitor these key metrics:
What to Test
1. Countdown Timer Length
Test these common timer lengths:
- Short (3-5 seconds): Higher completion rate, lower ad revenue
- Medium (6-10 seconds): Balanced approach
- Long (15-30 seconds): Higher ad revenue, higher bounce rate
2. Download Button
Test variations of:
- Color: Green, blue, orange, red
- Size: Small, medium, large
- Text: “Download”, “Get File”, “Download Now”, “Click Here”
- Position: Top, center, bottom of page
3. Ad Placement
Test different ad configurations:
- Number of ads: 1 vs 2 vs 3 ad units
- Position: Above content vs below vs sidebar
- Size: Standard sizes vs responsive
- Type: Display vs native vs video
4. Page Design
- Background: Dark vs light theme
- Layout: Centered vs full-width
- Content: Minimal vs detailed file info
- Branding: Logo prominent vs subtle
Analyzing Results
Key Metrics to Compare
- Revenue per visitor: Total earnings divided by visitors
- Click-through rate: Percentage who click download
- Ad viewability: Percentage of ads actually seen
- Bounce rate: Percentage who leave before download
- Time on page: How long users stay
Statistical Significance
Don’t declare a winner too early. Wait until:
- Each variant has 1,000+ visitors
- Test has run for at least 7 days
- Confidence level reaches 95%+
Common A/B Testing Mistakes
1. Testing Too Many Things at Once
Change only ONE element per test. If you change button color AND timer length, you won’t know which caused the difference.
2. Ending Tests Too Early
Early results can be misleading. A variant might look like a winner on day 1 but lose by day 7. Wait for statistical significance.
3. Ignoring Mobile
Desktop and mobile users behave differently. Segment your results or run separate tests for each device type.
Real-World Test Results
Here are some common findings from A/B tests on safelink pages:
- Green buttons: Often outperform blue by 5-10%
- 8-second timers: Sweet spot for most sites
- Dark backgrounds: Higher ad visibility than light
- File details: Showing file name/size increases trust
Implementing Winners
Once you have a winner:
- Deploy the winning variant to 100% of traffic
- Document what you learned
- Plan your next test
- Monitor for any regression
Conclusion
A/B testing transforms guesswork into data-driven decisions. By systematically testing elements of your safelink pages, you can incrementally improve revenue without risking your entire traffic. Start with one test today – even a 5% improvement adds up over millions of visitors.
Ready to optimize your safelink pages? Get WP Safelink with built-in A/B testing capabilities.
Analyzing Results
Key Metrics to Compare
- Revenue per visitor: Total earnings divided by visitors
- Click-through rate: Percentage who click download
- Ad viewability: Percentage of ads actually seen
- Bounce rate: Percentage who leave before download
- Time on page: How long users stay
Statistical Significance
Don’t declare a winner too early. Wait until:
- Each variant has 1,000+ visitors
- Test has run for at least 7 days
- Confidence level reaches 95%+
Common A/B Testing Mistakes
1. Testing Too Many Things at Once
Change only ONE element per test. If you change button color AND timer length, you won’t know which caused the difference.
2. Ending Tests Too Early
Early results can be misleading. A variant might look like a winner on day 1 but lose by day 7. Wait for statistical significance.
3. Ignoring Mobile
Desktop and mobile users behave differently. Segment your results or run separate tests for each device type.
Real-World Test Results
Here are some common findings from A/B tests on safelink pages:
- Green buttons: Often outperform blue by 5-10%
- 8-second timers: Sweet spot for most sites
- Dark backgrounds: Higher ad visibility than light
- File details: Showing file name/size increases trust
Implementing Winners
Once you have a winner:
- Deploy the winning variant to 100% of traffic
- Document what you learned
- Plan your next test
- Monitor for any regression
Conclusion
A/B testing transforms guesswork into data-driven decisions. By systematically testing elements of your safelink pages, you can incrementally improve revenue without risking your entire traffic. Start with one test today – even a 5% improvement adds up over millions of visitors.
Ready to optimize your safelink pages? Get WP Safelink with built-in A/B testing capabilities.
What to Test
1. Countdown Timer Length
Test these common timer lengths:
- Short (3-5 seconds): Higher completion rate, lower ad revenue
- Medium (6-10 seconds): Balanced approach
- Long (15-30 seconds): Higher ad revenue, higher bounce rate
2. Download Button
Test variations of:
- Color: Green, blue, orange, red
- Size: Small, medium, large
- Text: “Download”, “Get File”, “Download Now”, “Click Here”
- Position: Top, center, bottom of page
3. Ad Placement
Test different ad configurations:
- Number of ads: 1 vs 2 vs 3 ad units
- Position: Above content vs below vs sidebar
- Size: Standard sizes vs responsive
- Type: Display vs native vs video
4. Page Design
- Background: Dark vs light theme
- Layout: Centered vs full-width
- Content: Minimal vs detailed file info
- Branding: Logo prominent vs subtle
Analyzing Results
Key Metrics to Compare
- Revenue per visitor: Total earnings divided by visitors
- Click-through rate: Percentage who click download
- Ad viewability: Percentage of ads actually seen
- Bounce rate: Percentage who leave before download
- Time on page: How long users stay
Statistical Significance
Don’t declare a winner too early. Wait until:
- Each variant has 1,000+ visitors
- Test has run for at least 7 days
- Confidence level reaches 95%+
Common A/B Testing Mistakes
1. Testing Too Many Things at Once
Change only ONE element per test. If you change button color AND timer length, you won’t know which caused the difference.
2. Ending Tests Too Early
Early results can be misleading. A variant might look like a winner on day 1 but lose by day 7. Wait for statistical significance.
3. Ignoring Mobile
Desktop and mobile users behave differently. Segment your results or run separate tests for each device type.
Real-World Test Results
Here are some common findings from A/B tests on safelink pages:
- Green buttons: Often outperform blue by 5-10%
- 8-second timers: Sweet spot for most sites
- Dark backgrounds: Higher ad visibility than light
- File details: Showing file name/size increases trust
Implementing Winners
Once you have a winner:
- Deploy the winning variant to 100% of traffic
- Document what you learned
- Plan your next test
- Monitor for any regression
Conclusion
A/B testing transforms guesswork into data-driven decisions. By systematically testing elements of your safelink pages, you can incrementally improve revenue without risking your entire traffic. Start with one test today – even a 5% improvement adds up over millions of visitors.
Ready to optimize your safelink pages? Get WP Safelink with built-in A/B testing capabilities.
What is A/B Testing?
A/B testing (split testing) compares two versions of a page to see which performs better. You show Version A to half your visitors and Version B to the other half, then measure which generates more revenue.
Why A/B Test Safelink Pages?
Small changes can have big impacts on revenue:
- Timer length: 5 seconds vs 10 seconds – which earns more?
- Button color: Green vs blue – which gets more clicks?
- Ad placement: Above countdown vs below – which has higher viewability?
- Page layout: Minimal vs detailed – which converts better?
Setting Up A/B Tests in WP Safelink
Step 1: Create Two Page Variants
In WP Safelink, create two versions of your redirect page with one key difference:
- Go to WP Safelink ??? Templates
- Duplicate your current template
- Modify ONE element (e.g., timer length)
- Save as “Template B”
Step 2: Configure Traffic Split
Set up how traffic is distributed between variants:
- 50/50 split: Standard for most tests
- 90/10 split: For risky changes you want to test safely
- Traffic minimum: Need at least 1,000 visitors per variant for statistical significance
Step 3: Track Results
Monitor these key metrics:
What to Test
1. Countdown Timer Length
Test these common timer lengths:
- Short (3-5 seconds): Higher completion rate, lower ad revenue
- Medium (6-10 seconds): Balanced approach
- Long (15-30 seconds): Higher ad revenue, higher bounce rate
2. Download Button
Test variations of:
- Color: Green, blue, orange, red
- Size: Small, medium, large
- Text: “Download”, “Get File”, “Download Now”, “Click Here”
- Position: Top, center, bottom of page
3. Ad Placement
Test different ad configurations:
- Number of ads: 1 vs 2 vs 3 ad units
- Position: Above content vs below vs sidebar
- Size: Standard sizes vs responsive
- Type: Display vs native vs video
4. Page Design
- Background: Dark vs light theme
- Layout: Centered vs full-width
- Content: Minimal vs detailed file info
- Branding: Logo prominent vs subtle
Analyzing Results
Key Metrics to Compare
- Revenue per visitor: Total earnings divided by visitors
- Click-through rate: Percentage who click download
- Ad viewability: Percentage of ads actually seen
- Bounce rate: Percentage who leave before download
- Time on page: How long users stay
Statistical Significance
Don’t declare a winner too early. Wait until:
- Each variant has 1,000+ visitors
- Test has run for at least 7 days
- Confidence level reaches 95%+
Common A/B Testing Mistakes
1. Testing Too Many Things at Once
Change only ONE element per test. If you change button color AND timer length, you won’t know which caused the difference.
2. Ending Tests Too Early
Early results can be misleading. A variant might look like a winner on day 1 but lose by day 7. Wait for statistical significance.
3. Ignoring Mobile
Desktop and mobile users behave differently. Segment your results or run separate tests for each device type.
Real-World Test Results
Here are some common findings from A/B tests on safelink pages:
- Green buttons: Often outperform blue by 5-10%
- 8-second timers: Sweet spot for most sites
- Dark backgrounds: Higher ad visibility than light
- File details: Showing file name/size increases trust
Implementing Winners
Once you have a winner:
- Deploy the winning variant to 100% of traffic
- Document what you learned
- Plan your next test
- Monitor for any regression
Conclusion
A/B testing transforms guesswork into data-driven decisions. By systematically testing elements of your safelink pages, you can incrementally improve revenue without risking your entire traffic. Start with one test today – even a 5% improvement adds up over millions of visitors.
Ready to optimize your safelink pages? Get WP Safelink with built-in A/B testing capabilities.
Think your safelink pages are optimized? Without A/B testing, you’re just guessing. This guide shows you how to systematically test and improve your WP Safelink pages for maximum revenue.
What is A/B Testing?
A/B testing (split testing) compares two versions of a page to see which performs better. You show Version A to half your visitors and Version B to the other half, then measure which generates more revenue.
Why A/B Test Safelink Pages?
Small changes can have big impacts on revenue:
- Timer length: 5 seconds vs 10 seconds – which earns more?
- Button color: Green vs blue – which gets more clicks?
- Ad placement: Above countdown vs below – which has higher viewability?
- Page layout: Minimal vs detailed – which converts better?
Setting Up A/B Tests in WP Safelink
Step 1: Create Two Page Variants
In WP Safelink, create two versions of your redirect page with one key difference:
- Go to WP Safelink ??? Templates
- Duplicate your current template
- Modify ONE element (e.g., timer length)
- Save as “Template B”
Step 2: Configure Traffic Split
Set up how traffic is distributed between variants:
- 50/50 split: Standard for most tests
- 90/10 split: For risky changes you want to test safely
- Traffic minimum: Need at least 1,000 visitors per variant for statistical significance
Step 3: Track Results
Monitor these key metrics:
What to Test
1. Countdown Timer Length
Test these common timer lengths:
- Short (3-5 seconds): Higher completion rate, lower ad revenue
- Medium (6-10 seconds): Balanced approach
- Long (15-30 seconds): Higher ad revenue, higher bounce rate
2. Download Button
Test variations of:
- Color: Green, blue, orange, red
- Size: Small, medium, large
- Text: “Download”, “Get File”, “Download Now”, “Click Here”
- Position: Top, center, bottom of page
3. Ad Placement
Test different ad configurations:
- Number of ads: 1 vs 2 vs 3 ad units
- Position: Above content vs below vs sidebar
- Size: Standard sizes vs responsive
- Type: Display vs native vs video
4. Page Design
- Background: Dark vs light theme
- Layout: Centered vs full-width
- Content: Minimal vs detailed file info
- Branding: Logo prominent vs subtle
Analyzing Results
Key Metrics to Compare
- Revenue per visitor: Total earnings divided by visitors
- Click-through rate: Percentage who click download
- Ad viewability: Percentage of ads actually seen
- Bounce rate: Percentage who leave before download
- Time on page: How long users stay
Statistical Significance
Don’t declare a winner too early. Wait until:
- Each variant has 1,000+ visitors
- Test has run for at least 7 days
- Confidence level reaches 95%+
Common A/B Testing Mistakes
1. Testing Too Many Things at Once
Change only ONE element per test. If you change button color AND timer length, you won’t know which caused the difference.
2. Ending Tests Too Early
Early results can be misleading. A variant might look like a winner on day 1 but lose by day 7. Wait for statistical significance.
3. Ignoring Mobile
Desktop and mobile users behave differently. Segment your results or run separate tests for each device type.
Real-World Test Results
Here are some common findings from A/B tests on safelink pages:
- Green buttons: Often outperform blue by 5-10%
- 8-second timers: Sweet spot for most sites
- Dark backgrounds: Higher ad visibility than light
- File details: Showing file name/size increases trust
Implementing Winners
Once you have a winner:
- Deploy the winning variant to 100% of traffic
- Document what you learned
- Plan your next test
- Monitor for any regression
Conclusion
A/B testing transforms guesswork into data-driven decisions. By systematically testing elements of your safelink pages, you can incrementally improve revenue without risking your entire traffic. Start with one test today – even a 5% improvement adds up over millions of visitors.
Ready to optimize your safelink pages? Get WP Safelink with built-in A/B testing capabilities.
Analyzing Results
Key Metrics to Compare
- Revenue per visitor: Total earnings divided by visitors
- Click-through rate: Percentage who click download
- Ad viewability: Percentage of ads actually seen
- Bounce rate: Percentage who leave before download
- Time on page: How long users stay
Statistical Significance
Don’t declare a winner too early. Wait until:
- Each variant has 1,000+ visitors
- Test has run for at least 7 days
- Confidence level reaches 95%+
Common A/B Testing Mistakes
1. Testing Too Many Things at Once
Change only ONE element per test. If you change button color AND timer length, you won’t know which caused the difference.
2. Ending Tests Too Early
Early results can be misleading. A variant might look like a winner on day 1 but lose by day 7. Wait for statistical significance.
3. Ignoring Mobile
Desktop and mobile users behave differently. Segment your results or run separate tests for each device type.
Real-World Test Results
Here are some common findings from A/B tests on safelink pages:
- Green buttons: Often outperform blue by 5-10%
- 8-second timers: Sweet spot for most sites
- Dark backgrounds: Higher ad visibility than light
- File details: Showing file name/size increases trust
Implementing Winners
Once you have a winner:
- Deploy the winning variant to 100% of traffic
- Document what you learned
- Plan your next test
- Monitor for any regression
Conclusion
A/B testing transforms guesswork into data-driven decisions. By systematically testing elements of your safelink pages, you can incrementally improve revenue without risking your entire traffic. Start with one test today – even a 5% improvement adds up over millions of visitors.
Ready to optimize your safelink pages? Get WP Safelink with built-in A/B testing capabilities.
What to Test
1. Countdown Timer Length
Test these common timer lengths:
- Short (3-5 seconds): Higher completion rate, lower ad revenue
- Medium (6-10 seconds): Balanced approach
- Long (15-30 seconds): Higher ad revenue, higher bounce rate
2. Download Button
Test variations of:
- Color: Green, blue, orange, red
- Size: Small, medium, large
- Text: “Download”, “Get File”, “Download Now”, “Click Here”
- Position: Top, center, bottom of page
3. Ad Placement
Test different ad configurations:
- Number of ads: 1 vs 2 vs 3 ad units
- Position: Above content vs below vs sidebar
- Size: Standard sizes vs responsive
- Type: Display vs native vs video
4. Page Design
- Background: Dark vs light theme
- Layout: Centered vs full-width
- Content: Minimal vs detailed file info
- Branding: Logo prominent vs subtle
Analyzing Results
Key Metrics to Compare
- Revenue per visitor: Total earnings divided by visitors
- Click-through rate: Percentage who click download
- Ad viewability: Percentage of ads actually seen
- Bounce rate: Percentage who leave before download
- Time on page: How long users stay
Statistical Significance
Don’t declare a winner too early. Wait until:
- Each variant has 1,000+ visitors
- Test has run for at least 7 days
- Confidence level reaches 95%+
Common A/B Testing Mistakes
1. Testing Too Many Things at Once
Change only ONE element per test. If you change button color AND timer length, you won’t know which caused the difference.
2. Ending Tests Too Early
Early results can be misleading. A variant might look like a winner on day 1 but lose by day 7. Wait for statistical significance.
3. Ignoring Mobile
Desktop and mobile users behave differently. Segment your results or run separate tests for each device type.
Real-World Test Results
Here are some common findings from A/B tests on safelink pages:
- Green buttons: Often outperform blue by 5-10%
- 8-second timers: Sweet spot for most sites
- Dark backgrounds: Higher ad visibility than light
- File details: Showing file name/size increases trust
Implementing Winners
Once you have a winner:
- Deploy the winning variant to 100% of traffic
- Document what you learned
- Plan your next test
- Monitor for any regression
Conclusion
A/B testing transforms guesswork into data-driven decisions. By systematically testing elements of your safelink pages, you can incrementally improve revenue without risking your entire traffic. Start with one test today – even a 5% improvement adds up over millions of visitors.
Ready to optimize your safelink pages? Get WP Safelink with built-in A/B testing capabilities.
What is A/B Testing?
A/B testing (split testing) compares two versions of a page to see which performs better. You show Version A to half your visitors and Version B to the other half, then measure which generates more revenue.
Why A/B Test Safelink Pages?
Small changes can have big impacts on revenue:
- Timer length: 5 seconds vs 10 seconds – which earns more?
- Button color: Green vs blue – which gets more clicks?
- Ad placement: Above countdown vs below – which has higher viewability?
- Page layout: Minimal vs detailed – which converts better?
Setting Up A/B Tests in WP Safelink
Step 1: Create Two Page Variants
In WP Safelink, create two versions of your redirect page with one key difference:
- Go to WP Safelink ??? Templates
- Duplicate your current template
- Modify ONE element (e.g., timer length)
- Save as “Template B”
Step 2: Configure Traffic Split
Set up how traffic is distributed between variants:
- 50/50 split: Standard for most tests
- 90/10 split: For risky changes you want to test safely
- Traffic minimum: Need at least 1,000 visitors per variant for statistical significance
Step 3: Track Results
Monitor these key metrics:
What to Test
1. Countdown Timer Length
Test these common timer lengths:
- Short (3-5 seconds): Higher completion rate, lower ad revenue
- Medium (6-10 seconds): Balanced approach
- Long (15-30 seconds): Higher ad revenue, higher bounce rate
2. Download Button
Test variations of:
- Color: Green, blue, orange, red
- Size: Small, medium, large
- Text: “Download”, “Get File”, “Download Now”, “Click Here”
- Position: Top, center, bottom of page
3. Ad Placement
Test different ad configurations:
- Number of ads: 1 vs 2 vs 3 ad units
- Position: Above content vs below vs sidebar
- Size: Standard sizes vs responsive
- Type: Display vs native vs video
4. Page Design
- Background: Dark vs light theme
- Layout: Centered vs full-width
- Content: Minimal vs detailed file info
- Branding: Logo prominent vs subtle
Analyzing Results
Key Metrics to Compare
- Revenue per visitor: Total earnings divided by visitors
- Click-through rate: Percentage who click download
- Ad viewability: Percentage of ads actually seen
- Bounce rate: Percentage who leave before download
- Time on page: How long users stay
Statistical Significance
Don’t declare a winner too early. Wait until:
- Each variant has 1,000+ visitors
- Test has run for at least 7 days
- Confidence level reaches 95%+
Common A/B Testing Mistakes
1. Testing Too Many Things at Once
Change only ONE element per test. If you change button color AND timer length, you won’t know which caused the difference.
2. Ending Tests Too Early
Early results can be misleading. A variant might look like a winner on day 1 but lose by day 7. Wait for statistical significance.
3. Ignoring Mobile
Desktop and mobile users behave differently. Segment your results or run separate tests for each device type.
Real-World Test Results
Here are some common findings from A/B tests on safelink pages:
- Green buttons: Often outperform blue by 5-10%
- 8-second timers: Sweet spot for most sites
- Dark backgrounds: Higher ad visibility than light
- File details: Showing file name/size increases trust
Implementing Winners
Once you have a winner:
- Deploy the winning variant to 100% of traffic
- Document what you learned
- Plan your next test
- Monitor for any regression
Conclusion
A/B testing transforms guesswork into data-driven decisions. By systematically testing elements of your safelink pages, you can incrementally improve revenue without risking your entire traffic. Start with one test today – even a 5% improvement adds up over millions of visitors.
Ready to optimize your safelink pages? Get WP Safelink with built-in A/B testing capabilities.
Think your safelink pages are optimized? Without A/B testing, you’re just guessing. This guide shows you how to systematically test and improve your WP Safelink pages for maximum revenue.
What is A/B Testing?
A/B testing (split testing) compares two versions of a page to see which performs better. You show Version A to half your visitors and Version B to the other half, then measure which generates more revenue.
Why A/B Test Safelink Pages?
Small changes can have big impacts on revenue:
- Timer length: 5 seconds vs 10 seconds – which earns more?
- Button color: Green vs blue – which gets more clicks?
- Ad placement: Above countdown vs below – which has higher viewability?
- Page layout: Minimal vs detailed – which converts better?
Setting Up A/B Tests in WP Safelink
Step 1: Create Two Page Variants
In WP Safelink, create two versions of your redirect page with one key difference:
- Go to WP Safelink ??? Templates
- Duplicate your current template
- Modify ONE element (e.g., timer length)
- Save as “Template B”
Step 2: Configure Traffic Split
Set up how traffic is distributed between variants:
- 50/50 split: Standard for most tests
- 90/10 split: For risky changes you want to test safely
- Traffic minimum: Need at least 1,000 visitors per variant for statistical significance
Step 3: Track Results
Monitor these key metrics:
What to Test
1. Countdown Timer Length
Test these common timer lengths:
- Short (3-5 seconds): Higher completion rate, lower ad revenue
- Medium (6-10 seconds): Balanced approach
- Long (15-30 seconds): Higher ad revenue, higher bounce rate
2. Download Button
Test variations of:
- Color: Green, blue, orange, red
- Size: Small, medium, large
- Text: “Download”, “Get File”, “Download Now”, “Click Here”
- Position: Top, center, bottom of page
3. Ad Placement
Test different ad configurations:
- Number of ads: 1 vs 2 vs 3 ad units
- Position: Above content vs below vs sidebar
- Size: Standard sizes vs responsive
- Type: Display vs native vs video
4. Page Design
- Background: Dark vs light theme
- Layout: Centered vs full-width
- Content: Minimal vs detailed file info
- Branding: Logo prominent vs subtle
Analyzing Results
Key Metrics to Compare
- Revenue per visitor: Total earnings divided by visitors
- Click-through rate: Percentage who click download
- Ad viewability: Percentage of ads actually seen
- Bounce rate: Percentage who leave before download
- Time on page: How long users stay
Statistical Significance
Don’t declare a winner too early. Wait until:
- Each variant has 1,000+ visitors
- Test has run for at least 7 days
- Confidence level reaches 95%+
Common A/B Testing Mistakes
1. Testing Too Many Things at Once
Change only ONE element per test. If you change button color AND timer length, you won’t know which caused the difference.
2. Ending Tests Too Early
Early results can be misleading. A variant might look like a winner on day 1 but lose by day 7. Wait for statistical significance.
3. Ignoring Mobile
Desktop and mobile users behave differently. Segment your results or run separate tests for each device type.
Real-World Test Results
Here are some common findings from A/B tests on safelink pages:
- Green buttons: Often outperform blue by 5-10%
- 8-second timers: Sweet spot for most sites
- Dark backgrounds: Higher ad visibility than light
- File details: Showing file name/size increases trust
Implementing Winners
Once you have a winner:
- Deploy the winning variant to 100% of traffic
- Document what you learned
- Plan your next test
- Monitor for any regression
Conclusion
A/B testing transforms guesswork into data-driven decisions. By systematically testing elements of your safelink pages, you can incrementally improve revenue without risking your entire traffic. Start with one test today – even a 5% improvement adds up over millions of visitors.
Ready to optimize your safelink pages? Get WP Safelink with built-in A/B testing capabilities.
Common A/B Testing Mistakes
1. Testing Too Many Things at Once
Change only ONE element per test. If you change button color AND timer length, you won’t know which caused the difference.
2. Ending Tests Too Early
Early results can be misleading. A variant might look like a winner on day 1 but lose by day 7. Wait for statistical significance.
3. Ignoring Mobile
Desktop and mobile users behave differently. Segment your results or run separate tests for each device type.
Real-World Test Results
Here are some common findings from A/B tests on safelink pages:
- Green buttons: Often outperform blue by 5-10%
- 8-second timers: Sweet spot for most sites
- Dark backgrounds: Higher ad visibility than light
- File details: Showing file name/size increases trust
Implementing Winners
Once you have a winner:
- Deploy the winning variant to 100% of traffic
- Document what you learned
- Plan your next test
- Monitor for any regression
Conclusion
A/B testing transforms guesswork into data-driven decisions. By systematically testing elements of your safelink pages, you can incrementally improve revenue without risking your entire traffic. Start with one test today – even a 5% improvement adds up over millions of visitors.
Ready to optimize your safelink pages? Get WP Safelink with built-in A/B testing capabilities.
Analyzing Results
Key Metrics to Compare
- Revenue per visitor: Total earnings divided by visitors
- Click-through rate: Percentage who click download
- Ad viewability: Percentage of ads actually seen
- Bounce rate: Percentage who leave before download
- Time on page: How long users stay
Statistical Significance
Don’t declare a winner too early. Wait until:
- Each variant has 1,000+ visitors
- Test has run for at least 7 days
- Confidence level reaches 95%+
Common A/B Testing Mistakes
1. Testing Too Many Things at Once
Change only ONE element per test. If you change button color AND timer length, you won’t know which caused the difference.
2. Ending Tests Too Early
Early results can be misleading. A variant might look like a winner on day 1 but lose by day 7. Wait for statistical significance.
3. Ignoring Mobile
Desktop and mobile users behave differently. Segment your results or run separate tests for each device type.
Real-World Test Results
Here are some common findings from A/B tests on safelink pages:
- Green buttons: Often outperform blue by 5-10%
- 8-second timers: Sweet spot for most sites
- Dark backgrounds: Higher ad visibility than light
- File details: Showing file name/size increases trust
Implementing Winners
Once you have a winner:
- Deploy the winning variant to 100% of traffic
- Document what you learned
- Plan your next test
- Monitor for any regression
Conclusion
A/B testing transforms guesswork into data-driven decisions. By systematically testing elements of your safelink pages, you can incrementally improve revenue without risking your entire traffic. Start with one test today – even a 5% improvement adds up over millions of visitors.
Ready to optimize your safelink pages? Get WP Safelink with built-in A/B testing capabilities.
What to Test
1. Countdown Timer Length
Test these common timer lengths:
- Short (3-5 seconds): Higher completion rate, lower ad revenue
- Medium (6-10 seconds): Balanced approach
- Long (15-30 seconds): Higher ad revenue, higher bounce rate
2. Download Button
Test variations of:
- Color: Green, blue, orange, red
- Size: Small, medium, large
- Text: “Download”, “Get File”, “Download Now”, “Click Here”
- Position: Top, center, bottom of page
3. Ad Placement
Test different ad configurations:
- Number of ads: 1 vs 2 vs 3 ad units
- Position: Above content vs below vs sidebar
- Size: Standard sizes vs responsive
- Type: Display vs native vs video
4. Page Design
- Background: Dark vs light theme
- Layout: Centered vs full-width
- Content: Minimal vs detailed file info
- Branding: Logo prominent vs subtle
Analyzing Results
Key Metrics to Compare
- Revenue per visitor: Total earnings divided by visitors
- Click-through rate: Percentage who click download
- Ad viewability: Percentage of ads actually seen
- Bounce rate: Percentage who leave before download
- Time on page: How long users stay
Statistical Significance
Don’t declare a winner too early. Wait until:
- Each variant has 1,000+ visitors
- Test has run for at least 7 days
- Confidence level reaches 95%+
Common A/B Testing Mistakes
1. Testing Too Many Things at Once
Change only ONE element per test. If you change button color AND timer length, you won’t know which caused the difference.
2. Ending Tests Too Early
Early results can be misleading. A variant might look like a winner on day 1 but lose by day 7. Wait for statistical significance.
3. Ignoring Mobile
Desktop and mobile users behave differently. Segment your results or run separate tests for each device type.
Real-World Test Results
Here are some common findings from A/B tests on safelink pages:
- Green buttons: Often outperform blue by 5-10%
- 8-second timers: Sweet spot for most sites
- Dark backgrounds: Higher ad visibility than light
- File details: Showing file name/size increases trust
Implementing Winners
Once you have a winner:
- Deploy the winning variant to 100% of traffic
- Document what you learned
- Plan your next test
- Monitor for any regression
Conclusion
A/B testing transforms guesswork into data-driven decisions. By systematically testing elements of your safelink pages, you can incrementally improve revenue without risking your entire traffic. Start with one test today – even a 5% improvement adds up over millions of visitors.
Ready to optimize your safelink pages? Get WP Safelink with built-in A/B testing capabilities.
What is A/B Testing?
A/B testing (split testing) compares two versions of a page to see which performs better. You show Version A to half your visitors and Version B to the other half, then measure which generates more revenue.
Why A/B Test Safelink Pages?
Small changes can have big impacts on revenue:
- Timer length: 5 seconds vs 10 seconds – which earns more?
- Button color: Green vs blue – which gets more clicks?
- Ad placement: Above countdown vs below – which has higher viewability?
- Page layout: Minimal vs detailed – which converts better?
Setting Up A/B Tests in WP Safelink
Step 1: Create Two Page Variants
In WP Safelink, create two versions of your redirect page with one key difference:
- Go to WP Safelink ??? Templates
- Duplicate your current template
- Modify ONE element (e.g., timer length)
- Save as “Template B”
Step 2: Configure Traffic Split
Set up how traffic is distributed between variants:
- 50/50 split: Standard for most tests
- 90/10 split: For risky changes you want to test safely
- Traffic minimum: Need at least 1,000 visitors per variant for statistical significance
Step 3: Track Results
Monitor these key metrics:
What to Test
1. Countdown Timer Length
Test these common timer lengths:
- Short (3-5 seconds): Higher completion rate, lower ad revenue
- Medium (6-10 seconds): Balanced approach
- Long (15-30 seconds): Higher ad revenue, higher bounce rate
2. Download Button
Test variations of:
- Color: Green, blue, orange, red
- Size: Small, medium, large
- Text: “Download”, “Get File”, “Download Now”, “Click Here”
- Position: Top, center, bottom of page
3. Ad Placement
Test different ad configurations:
- Number of ads: 1 vs 2 vs 3 ad units
- Position: Above content vs below vs sidebar
- Size: Standard sizes vs responsive
- Type: Display vs native vs video
4. Page Design
- Background: Dark vs light theme
- Layout: Centered vs full-width
- Content: Minimal vs detailed file info
- Branding: Logo prominent vs subtle
Analyzing Results
Key Metrics to Compare
- Revenue per visitor: Total earnings divided by visitors
- Click-through rate: Percentage who click download
- Ad viewability: Percentage of ads actually seen
- Bounce rate: Percentage who leave before download
- Time on page: How long users stay
Statistical Significance
Don’t declare a winner too early. Wait until:
- Each variant has 1,000+ visitors
- Test has run for at least 7 days
- Confidence level reaches 95%+
Common A/B Testing Mistakes
1. Testing Too Many Things at Once
Change only ONE element per test. If you change button color AND timer length, you won’t know which caused the difference.
2. Ending Tests Too Early
Early results can be misleading. A variant might look like a winner on day 1 but lose by day 7. Wait for statistical significance.
3. Ignoring Mobile
Desktop and mobile users behave differently. Segment your results or run separate tests for each device type.
Real-World Test Results
Here are some common findings from A/B tests on safelink pages:
- Green buttons: Often outperform blue by 5-10%
- 8-second timers: Sweet spot for most sites
- Dark backgrounds: Higher ad visibility than light
- File details: Showing file name/size increases trust
Implementing Winners
Once you have a winner:
- Deploy the winning variant to 100% of traffic
- Document what you learned
- Plan your next test
- Monitor for any regression
Conclusion
A/B testing transforms guesswork into data-driven decisions. By systematically testing elements of your safelink pages, you can incrementally improve revenue without risking your entire traffic. Start with one test today – even a 5% improvement adds up over millions of visitors.
Ready to optimize your safelink pages? Get WP Safelink with built-in A/B testing capabilities.
Think your safelink pages are optimized? Without A/B testing, you’re just guessing. This guide shows you how to systematically test and improve your WP Safelink pages for maximum revenue.
What is A/B Testing?
A/B testing (split testing) compares two versions of a page to see which performs better. You show Version A to half your visitors and Version B to the other half, then measure which generates more revenue.
Why A/B Test Safelink Pages?
Small changes can have big impacts on revenue:
- Timer length: 5 seconds vs 10 seconds – which earns more?
- Button color: Green vs blue – which gets more clicks?
- Ad placement: Above countdown vs below – which has higher viewability?
- Page layout: Minimal vs detailed – which converts better?
Setting Up A/B Tests in WP Safelink
Step 1: Create Two Page Variants
In WP Safelink, create two versions of your redirect page with one key difference:
- Go to WP Safelink ??? Templates
- Duplicate your current template
- Modify ONE element (e.g., timer length)
- Save as “Template B”
Step 2: Configure Traffic Split
Set up how traffic is distributed between variants:
- 50/50 split: Standard for most tests
- 90/10 split: For risky changes you want to test safely
- Traffic minimum: Need at least 1,000 visitors per variant for statistical significance
Step 3: Track Results
Monitor these key metrics:
What to Test
1. Countdown Timer Length
Test these common timer lengths:
- Short (3-5 seconds): Higher completion rate, lower ad revenue
- Medium (6-10 seconds): Balanced approach
- Long (15-30 seconds): Higher ad revenue, higher bounce rate
2. Download Button
Test variations of:
- Color: Green, blue, orange, red
- Size: Small, medium, large
- Text: “Download”, “Get File”, “Download Now”, “Click Here”
- Position: Top, center, bottom of page
3. Ad Placement
Test different ad configurations:
- Number of ads: 1 vs 2 vs 3 ad units
- Position: Above content vs below vs sidebar
- Size: Standard sizes vs responsive
- Type: Display vs native vs video
4. Page Design
- Background: Dark vs light theme
- Layout: Centered vs full-width
- Content: Minimal vs detailed file info
- Branding: Logo prominent vs subtle
Analyzing Results
Key Metrics to Compare
- Revenue per visitor: Total earnings divided by visitors
- Click-through rate: Percentage who click download
- Ad viewability: Percentage of ads actually seen
- Bounce rate: Percentage who leave before download
- Time on page: How long users stay
Statistical Significance
Don’t declare a winner too early. Wait until:
- Each variant has 1,000+ visitors
- Test has run for at least 7 days
- Confidence level reaches 95%+
Common A/B Testing Mistakes
1. Testing Too Many Things at Once
Change only ONE element per test. If you change button color AND timer length, you won’t know which caused the difference.
2. Ending Tests Too Early
Early results can be misleading. A variant might look like a winner on day 1 but lose by day 7. Wait for statistical significance.
3. Ignoring Mobile
Desktop and mobile users behave differently. Segment your results or run separate tests for each device type.
Real-World Test Results
Here are some common findings from A/B tests on safelink pages:
- Green buttons: Often outperform blue by 5-10%
- 8-second timers: Sweet spot for most sites
- Dark backgrounds: Higher ad visibility than light
- File details: Showing file name/size increases trust
Implementing Winners
Once you have a winner:
- Deploy the winning variant to 100% of traffic
- Document what you learned
- Plan your next test
- Monitor for any regression
Conclusion
A/B testing transforms guesswork into data-driven decisions. By systematically testing elements of your safelink pages, you can incrementally improve revenue without risking your entire traffic. Start with one test today – even a 5% improvement adds up over millions of visitors.
Ready to optimize your safelink pages? Get WP Safelink with built-in A/B testing capabilities.
Real-World Test Results
Here are some common findings from A/B tests on safelink pages:
- Green buttons: Often outperform blue by 5-10%
- 8-second timers: Sweet spot for most sites
- Dark backgrounds: Higher ad visibility than light
- File details: Showing file name/size increases trust
Implementing Winners
Once you have a winner:
- Deploy the winning variant to 100% of traffic
- Document what you learned
- Plan your next test
- Monitor for any regression
Conclusion
A/B testing transforms guesswork into data-driven decisions. By systematically testing elements of your safelink pages, you can incrementally improve revenue without risking your entire traffic. Start with one test today – even a 5% improvement adds up over millions of visitors.
Ready to optimize your safelink pages? Get WP Safelink with built-in A/B testing capabilities.
Common A/B Testing Mistakes
1. Testing Too Many Things at Once
Change only ONE element per test. If you change button color AND timer length, you won’t know which caused the difference.
2. Ending Tests Too Early
Early results can be misleading. A variant might look like a winner on day 1 but lose by day 7. Wait for statistical significance.
3. Ignoring Mobile
Desktop and mobile users behave differently. Segment your results or run separate tests for each device type.
Real-World Test Results
Here are some common findings from A/B tests on safelink pages:
- Green buttons: Often outperform blue by 5-10%
- 8-second timers: Sweet spot for most sites
- Dark backgrounds: Higher ad visibility than light
- File details: Showing file name/size increases trust
Implementing Winners
Once you have a winner:
- Deploy the winning variant to 100% of traffic
- Document what you learned
- Plan your next test
- Monitor for any regression
Conclusion
A/B testing transforms guesswork into data-driven decisions. By systematically testing elements of your safelink pages, you can incrementally improve revenue without risking your entire traffic. Start with one test today – even a 5% improvement adds up over millions of visitors.
Ready to optimize your safelink pages? Get WP Safelink with built-in A/B testing capabilities.
Analyzing Results
Key Metrics to Compare
- Revenue per visitor: Total earnings divided by visitors
- Click-through rate: Percentage who click download
- Ad viewability: Percentage of ads actually seen
- Bounce rate: Percentage who leave before download
- Time on page: How long users stay
Statistical Significance
Don’t declare a winner too early. Wait until:
- Each variant has 1,000+ visitors
- Test has run for at least 7 days
- Confidence level reaches 95%+
Common A/B Testing Mistakes
1. Testing Too Many Things at Once
Change only ONE element per test. If you change button color AND timer length, you won’t know which caused the difference.
2. Ending Tests Too Early
Early results can be misleading. A variant might look like a winner on day 1 but lose by day 7. Wait for statistical significance.
3. Ignoring Mobile
Desktop and mobile users behave differently. Segment your results or run separate tests for each device type.
Real-World Test Results
Here are some common findings from A/B tests on safelink pages:
- Green buttons: Often outperform blue by 5-10%
- 8-second timers: Sweet spot for most sites
- Dark backgrounds: Higher ad visibility than light
- File details: Showing file name/size increases trust
Implementing Winners
Once you have a winner:
- Deploy the winning variant to 100% of traffic
- Document what you learned
- Plan your next test
- Monitor for any regression
Conclusion
A/B testing transforms guesswork into data-driven decisions. By systematically testing elements of your safelink pages, you can incrementally improve revenue without risking your entire traffic. Start with one test today – even a 5% improvement adds up over millions of visitors.
Ready to optimize your safelink pages? Get WP Safelink with built-in A/B testing capabilities.
What to Test
1. Countdown Timer Length
Test these common timer lengths:
- Short (3-5 seconds): Higher completion rate, lower ad revenue
- Medium (6-10 seconds): Balanced approach
- Long (15-30 seconds): Higher ad revenue, higher bounce rate
2. Download Button
Test variations of:
- Color: Green, blue, orange, red
- Size: Small, medium, large
- Text: “Download”, “Get File”, “Download Now”, “Click Here”
- Position: Top, center, bottom of page
3. Ad Placement
Test different ad configurations:
- Number of ads: 1 vs 2 vs 3 ad units
- Position: Above content vs below vs sidebar
- Size: Standard sizes vs responsive
- Type: Display vs native vs video
4. Page Design
- Background: Dark vs light theme
- Layout: Centered vs full-width
- Content: Minimal vs detailed file info
- Branding: Logo prominent vs subtle
Analyzing Results
Key Metrics to Compare
- Revenue per visitor: Total earnings divided by visitors
- Click-through rate: Percentage who click download
- Ad viewability: Percentage of ads actually seen
- Bounce rate: Percentage who leave before download
- Time on page: How long users stay
Statistical Significance
Don’t declare a winner too early. Wait until:
- Each variant has 1,000+ visitors
- Test has run for at least 7 days
- Confidence level reaches 95%+
Common A/B Testing Mistakes
1. Testing Too Many Things at Once
Change only ONE element per test. If you change button color AND timer length, you won’t know which caused the difference.
2. Ending Tests Too Early
Early results can be misleading. A variant might look like a winner on day 1 but lose by day 7. Wait for statistical significance.
3. Ignoring Mobile
Desktop and mobile users behave differently. Segment your results or run separate tests for each device type.
Real-World Test Results
Here are some common findings from A/B tests on safelink pages:
- Green buttons: Often outperform blue by 5-10%
- 8-second timers: Sweet spot for most sites
- Dark backgrounds: Higher ad visibility than light
- File details: Showing file name/size increases trust
Implementing Winners
Once you have a winner:
- Deploy the winning variant to 100% of traffic
- Document what you learned
- Plan your next test
- Monitor for any regression
Conclusion
A/B testing transforms guesswork into data-driven decisions. By systematically testing elements of your safelink pages, you can incrementally improve revenue without risking your entire traffic. Start with one test today – even a 5% improvement adds up over millions of visitors.
Ready to optimize your safelink pages? Get WP Safelink with built-in A/B testing capabilities.
What is A/B Testing?
A/B testing (split testing) compares two versions of a page to see which performs better. You show Version A to half your visitors and Version B to the other half, then measure which generates more revenue.
Why A/B Test Safelink Pages?
Small changes can have big impacts on revenue:
- Timer length: 5 seconds vs 10 seconds – which earns more?
- Button color: Green vs blue – which gets more clicks?
- Ad placement: Above countdown vs below – which has higher viewability?
- Page layout: Minimal vs detailed – which converts better?
Setting Up A/B Tests in WP Safelink
Step 1: Create Two Page Variants
In WP Safelink, create two versions of your redirect page with one key difference:
- Go to WP Safelink ??? Templates
- Duplicate your current template
- Modify ONE element (e.g., timer length)
- Save as “Template B”
Step 2: Configure Traffic Split
Set up how traffic is distributed between variants:
- 50/50 split: Standard for most tests
- 90/10 split: For risky changes you want to test safely
- Traffic minimum: Need at least 1,000 visitors per variant for statistical significance
Step 3: Track Results
Monitor these key metrics:
What to Test
1. Countdown Timer Length
Test these common timer lengths:
- Short (3-5 seconds): Higher completion rate, lower ad revenue
- Medium (6-10 seconds): Balanced approach
- Long (15-30 seconds): Higher ad revenue, higher bounce rate
2. Download Button
Test variations of:
- Color: Green, blue, orange, red
- Size: Small, medium, large
- Text: “Download”, “Get File”, “Download Now”, “Click Here”
- Position: Top, center, bottom of page
3. Ad Placement
Test different ad configurations:
- Number of ads: 1 vs 2 vs 3 ad units
- Position: Above content vs below vs sidebar
- Size: Standard sizes vs responsive
- Type: Display vs native vs video
4. Page Design
- Background: Dark vs light theme
- Layout: Centered vs full-width
- Content: Minimal vs detailed file info
- Branding: Logo prominent vs subtle
Analyzing Results
Key Metrics to Compare
- Revenue per visitor: Total earnings divided by visitors
- Click-through rate: Percentage who click download
- Ad viewability: Percentage of ads actually seen
- Bounce rate: Percentage who leave before download
- Time on page: How long users stay
Statistical Significance
Don’t declare a winner too early. Wait until:
- Each variant has 1,000+ visitors
- Test has run for at least 7 days
- Confidence level reaches 95%+
Common A/B Testing Mistakes
1. Testing Too Many Things at Once
Change only ONE element per test. If you change button color AND timer length, you won’t know which caused the difference.
2. Ending Tests Too Early
Early results can be misleading. A variant might look like a winner on day 1 but lose by day 7. Wait for statistical significance.
3. Ignoring Mobile
Desktop and mobile users behave differently. Segment your results or run separate tests for each device type.
Real-World Test Results
Here are some common findings from A/B tests on safelink pages:
- Green buttons: Often outperform blue by 5-10%
- 8-second timers: Sweet spot for most sites
- Dark backgrounds: Higher ad visibility than light
- File details: Showing file name/size increases trust
Implementing Winners
Once you have a winner:
- Deploy the winning variant to 100% of traffic
- Document what you learned
- Plan your next test
- Monitor for any regression
Conclusion
A/B testing transforms guesswork into data-driven decisions. By systematically testing elements of your safelink pages, you can incrementally improve revenue without risking your entire traffic. Start with one test today – even a 5% improvement adds up over millions of visitors.
Ready to optimize your safelink pages? Get WP Safelink with built-in A/B testing capabilities.
Think your safelink pages are optimized? Without A/B testing, you’re just guessing. This guide shows you how to systematically test and improve your WP Safelink pages for maximum revenue.
What is A/B Testing?
A/B testing (split testing) compares two versions of a page to see which performs better. You show Version A to half your visitors and Version B to the other half, then measure which generates more revenue.
Why A/B Test Safelink Pages?
Small changes can have big impacts on revenue:
- Timer length: 5 seconds vs 10 seconds – which earns more?
- Button color: Green vs blue – which gets more clicks?
- Ad placement: Above countdown vs below – which has higher viewability?
- Page layout: Minimal vs detailed – which converts better?
Setting Up A/B Tests in WP Safelink
Step 1: Create Two Page Variants
In WP Safelink, create two versions of your redirect page with one key difference:
- Go to WP Safelink ??? Templates
- Duplicate your current template
- Modify ONE element (e.g., timer length)
- Save as “Template B”
Step 2: Configure Traffic Split
Set up how traffic is distributed between variants:
- 50/50 split: Standard for most tests
- 90/10 split: For risky changes you want to test safely
- Traffic minimum: Need at least 1,000 visitors per variant for statistical significance
Step 3: Track Results
Monitor these key metrics:
What to Test
1. Countdown Timer Length
Test these common timer lengths:
- Short (3-5 seconds): Higher completion rate, lower ad revenue
- Medium (6-10 seconds): Balanced approach
- Long (15-30 seconds): Higher ad revenue, higher bounce rate
2. Download Button
Test variations of:
- Color: Green, blue, orange, red
- Size: Small, medium, large
- Text: “Download”, “Get File”, “Download Now”, “Click Here”
- Position: Top, center, bottom of page
3. Ad Placement
Test different ad configurations:
- Number of ads: 1 vs 2 vs 3 ad units
- Position: Above content vs below vs sidebar
- Size: Standard sizes vs responsive
- Type: Display vs native vs video
4. Page Design
- Background: Dark vs light theme
- Layout: Centered vs full-width
- Content: Minimal vs detailed file info
- Branding: Logo prominent vs subtle
Analyzing Results
Key Metrics to Compare
- Revenue per visitor: Total earnings divided by visitors
- Click-through rate: Percentage who click download
- Ad viewability: Percentage of ads actually seen
- Bounce rate: Percentage who leave before download
- Time on page: How long users stay
Statistical Significance
Don’t declare a winner too early. Wait until:
- Each variant has 1,000+ visitors
- Test has run for at least 7 days
- Confidence level reaches 95%+
Common A/B Testing Mistakes
1. Testing Too Many Things at Once
Change only ONE element per test. If you change button color AND timer length, you won’t know which caused the difference.
2. Ending Tests Too Early
Early results can be misleading. A variant might look like a winner on day 1 but lose by day 7. Wait for statistical significance.
3. Ignoring Mobile
Desktop and mobile users behave differently. Segment your results or run separate tests for each device type.
Real-World Test Results
Here are some common findings from A/B tests on safelink pages:
- Green buttons: Often outperform blue by 5-10%
- 8-second timers: Sweet spot for most sites
- Dark backgrounds: Higher ad visibility than light
- File details: Showing file name/size increases trust
Implementing Winners
Once you have a winner:
- Deploy the winning variant to 100% of traffic
- Document what you learned
- Plan your next test
- Monitor for any regression
Conclusion
A/B testing transforms guesswork into data-driven decisions. By systematically testing elements of your safelink pages, you can incrementally improve revenue without risking your entire traffic. Start with one test today – even a 5% improvement adds up over millions of visitors.
Ready to optimize your safelink pages? Get WP Safelink with built-in A/B testing capabilities.